Request Free Sample ×

Kindly complete the form below to receive a free sample of this Report

* Please use a valid business email

Leading companies partner with us for data-driven Insights

clients tt-cursor
Hero Background

Marché du cidre

ID: MRFR/FnB/1904-HCR
110 Pages
Tejas Chaudhary
Last Updated: May 01, 2026

Rapport de recherche sur le marché du cidre Informations par produit (cidre pétillant, cidre tranquille et vin de pomme), par source (pomme, aromatisé aux fruits, perry et autres), et par région (Amérique du Nord, Europe, Asie-Pacifique et le reste du monde) – Prévisions du marché jusqu'en 2035

Partager
Download PDF ×

We do not share your information with anyone. However, we may send you emails based on your report interest from time to time. You may contact us at any time to opt-out.

Cider Market Infographic
Purchase Options
  1. 1 SECTION I : RÉSUMÉ EXÉCUTIF ET POINTS CLÉS
    1. 1.1 RÉSUMÉ EXÉCUTIF
      1. 1.1.1 Vue d'ensemble du marché
      2. 1.1.2 Conclusions clés
      3. 1.1.3 Segmentation du marché
      4. 1.1.4 Paysage concurrentiel
      5. 1.1.5 Défis et opportunités
      6. 1.1.6 Perspectives futures
  2. 2 SECTION II : DÉLIMITATION, MÉTHODOLOGIE ET STRUCTURE DU MARCHÉ
    1. 2.1 INTRODUCTION AU MARCHÉ
      1. 2.1.1 Définition
      2. 2.1.2 Portée de l'étude
        1. 2.1.2.1 Objectif de recherche
        2. 2.1.2.2 Hypothèse
        3. 2.1.2.3 Limitations
    2. 2.2 MÉTHODOLOGIE DE RECHERCHE
      1. 2.2.1 Vue d'ensemble
      2. 2.2.2 Extraction de données
      3. 2.2.3 Recherche secondaire
      4. 2.2.4 Recherche primaire
        1. 2.2.4.1 Interviews primaires et processus de collecte d'informations
        2. 2.2.4.2 Répartition des répondants principaux
      5. 2.2.5 Modèle de prévision
      6. 2.2.6 Estimation de la taille du marché
        1. 2.2.6.1 Approche ascendante
        2. 2.2.6.2 Approche descendante
      7. 2.2.7 Triangulation des données
      8. 2.2.8 Validation
  3. 3 SECTION III : ANALYSE QUALITATIVE
    1. 3.1 DYNAMIQUE DU MARCHÉ
      1. 3.1.1 Vue d'ensemble
      2. 3.1.2 Facteurs moteurs
      3. 3.1.3 Contraintes
      4. 3.1.4 Opportunités
    2. 3.2 ANALYSE DES FACTEURS DU MARCHÉ
      1. 3.2.1 Analyse de la chaîne de valeur
      2. 3.2.2 Analyse des cinq forces de Porter
        1. 3.2.2.1 Pouvoir de négociation des fournisseurs
        2. 3.2.2.2 Pouvoir de négociation des acheteurs
        3. 3.2.2.3 Menace des nouveaux entrants
        4. 3.2.2.4 Menace des substituts
        5. 3.2.2.5 Intensité de la rivalité
      3. 3.2.3 Analyse d'impact du COVID-19
        1. 3.2.3.1 Analyse d'impact sur le marché
        2. 3.2.3.2 Impact régional
        3. 3.2.3.3 Analyse des opportunités et des menaces
  4. 4 SECTION IV : ANALYSE QUANTITATIVE
    1. 4.1 Alimentation, Boissons & Nutrition, PAR Produit (milliards USD)
      1. 4.1.1 Cidre pétillant
      2. 4.1.2 Non pétillant
      3. 4.1.3 Vin de pomme
    2. 4.2 Alimentation, Boissons & Nutrition, PAR Source (milliards USD)
      1. 4.2.1 Pomme
      2. 4.2.2 Arôme de fruit
      3. 4.2.3 Perry
      4. 4.2.4 Autres
    3. 4.3 Alimentation, Boissons & Nutrition, PAR Région (milliards USD)
      1. 4.3.1 Amérique du Nord
        1. 4.3.1.1 États-Unis
        2. 4.3.1.2 Canada
      2. 4.3.2 Europe
        1. 4.3.2.1 Allemagne
        2. 4.3.2.2 Royaume-Uni
        3. 4.3.2.3 France
        4. 4.3.2.4 Russie
        5. 4.3.2.5 Italie
        6. 4.3.2.6 Espagne
        7. 4.3.2.7 Reste de l'Europe
      3. 4.3.3 APAC
        1. 4.3.3.1 Chine
        2. 4.3.3.2 Inde
        3. 4.3.3.3 Japon
        4. 4.3.3.4 Corée du Sud
        5. 4.3.3.5 Malaisie
        6. 4.3.3.6 Thaïlande
        7. 4.3.3.7 Indonésie
        8. 4.3.3.8 Reste de l'APAC
      4. 4.3.4 Amérique du Sud
        1. 4.3.4.1 Brésil
        2. 4.3.4.2 Mexique
        3. 4.3.4.3 Argentine
        4. 4.3.4.4 Reste de l'Amérique du Sud
      5. 4.3.5 MEA
        1. 4.3.5.1 Pays du CCG
        2. 4.3.5.2 Afrique du Sud
        3. 4.3.5.3 Reste de la MEA
  5. 5 SECTION V : ANALYSE CONCURRENTIELLE
    1. 5.1 Paysage concurrentiel
      1. 5.1.1 Vue d'ensemble
      2. 5.1.2 Analyse concurrentielle
      3. 5.1.3 Analyse de part de marché
      4. 5.1.4 Stratégie de croissance majeure dans l'Alimentation, Boissons & Nutrition
      5. 5.1.5 Évaluation comparative
      6. 5.1.6 Acteurs principaux en termes de nombre de développements dans l'Alimentation, Boissons & Nutrition
      7. 5.1.7 Développements clés et stratégies de croissance
        1. 5.1.7.1 Lancement de nouveaux produits/Déploiement de services
        2. 5.1.7.2 Fusions & Acquisitions
        3. 5.1.7.3 Coentreprises
      8. 5.1.8 Matrice financière des principaux acteurs
        1. 5.1.8.1 Ventes et revenu d'exploitation
        2. 5.1.8.2 Dépenses de R&D des principaux acteurs. 2023
    2. 5.2 Profils d'entreprise
      1. 5.2.1 Angry Orchard (États-Unis)
        1. 5.2.1.1 Vue d'ensemble financière
        2. 5.2.1.2 Produits offerts
        3. 5.2.1.3 Développements clés
        4. 5.2.1.4 Analyse SWOT
        5. 5.2.1.5 Stratégies clés
      2. 5.2.2 Strongbow (Royaume-Uni)
        1. 5.2.2.1 Vue d'ensemble financière
        2. 5.2.2.2 Produits offerts
        3. 5.2.2.3 Développements clés
        4. 5.2.2.4 Analyse SWOT
        5. 5.2.2.5 Stratégies clés
      3. 5.2.3 Woodchuck Hard Cider (États-Unis)
        1. 5.2.3.1 Vue d'ensemble financière
        2. 5.2.3.2 Produits offerts
        3. 5.2.3.3 Développements clés
        4. 5.2.3.4 Analyse SWOT
        5. 5.2.3.5 Stratégies clés
      4. 5.2.4 Magners (Irlande)
        1. 5.2.4.1 Vue d'ensemble financière
        2. 5.2.4.2 Produits offerts
        3. 5.2.4.3 Développements clés
        4. 5.2.4.4 Analyse SWOT
        5. 5.2.4.5 Stratégies clés
      5. 5.2.5 Ciderboys (États-Unis)
        1. 5.2.5.1 Vue d'ensemble financière
        2. 5.2.5.2 Produits offerts
        3. 5.2.5.3 Développements clés
        4. 5.2.5.4 Analyse SWOT
        5. 5.2.5.5 Stratégies clés
      6. 5.2.6 Rekorderlig (Suède)
        1. 5.2.6.1 Vue d'ensemble financière
        2. 5.2.6.2 Produits offerts
        3. 5.2.6.3 Développements clés
        4. 5.2.6.4 Analyse SWOT
        5. 5.2.6.5 Stratégies clés
      7. 5.2.7 Somersby (Danemark)
        1. 5.2.7.1 Vue d'ensemble financière
        2. 5.2.7.2 Produits offerts
        3. 5.2.7.3 Développements clés
        4. 5.2.7.4 Analyse SWOT
        5. 5.2.7.5 Stratégies clés
      8. 5.2.8 Kopparberg (Suède)
        1. 5.2.8.1 Vue d'ensemble financière
        2. 5.2.8.2 Produits offerts
        3. 5.2.8.3 Développements clés
        4. 5.2.8.4 Analyse SWOT
        5. 5.2.8.5 Stratégies clés
      9. 5.2.9 Crispin Cider (États-Unis)
        1. 5.2.9.1 Vue d'ensemble financière
        2. 5.2.9.2 Produits offerts
        3. 5.2.9.3 Développements clés
        4. 5.2.9.4 Analyse SWOT
        5. 5.2.9.5 Stratégies clés
    3. 5.3 Annexe
      1. 5.3.1 Références
      2. 5.3.2 Rapports connexes
  6. 6 LISTE DES FIGURES
    1. 6.1 SYNOPSIS DU MARCHÉ
    2. 6.2 ANALYSE DU MARCHÉ EN AMÉRIQUE DU NORD
    3. 6.3 ANALYSE DU MARCHÉ AUX ÉTATS-UNIS PAR PRODUIT
    4. 6.4 ANALYSE DU MARCHÉ AUX ÉTATS-UNIS PAR SOURCE
    5. 6.5 ANALYSE DU MARCHÉ AU CANADA PAR PRODUIT
    6. 6.6 ANALYSE DU MARCHÉ AU CANADA PAR SOURCE
    7. 6.7 ANALYSE DU MARCHÉ EN EUROPE
    8. 6.8 ANALYSE DU MARCHÉ EN ALLEMAGNE PAR PRODUIT
    9. 6.9 ANALYSE DU MARCHÉ EN ALLEMAGNE PAR SOURCE
    10. 6.10 ANALYSE DU MARCHÉ AU ROYAUME-UNI PAR PRODUIT
    11. 6.11 ANALYSE DU MARCHÉ AU ROYAUME-UNI PAR SOURCE
    12. 6.12 ANALYSE DU MARCHÉ EN FRANCE PAR PRODUIT
    13. 6.13 ANALYSE DU MARCHÉ EN FRANCE PAR SOURCE
    14. 6.14 ANALYSE DU MARCHÉ EN RUSSIE PAR PRODUIT
    15. 6.15 ANALYSE DU MARCHÉ EN RUSSIE PAR SOURCE
    16. 6.16 ANALYSE DU MARCHÉ EN ITALIE PAR PRODUIT
    17. 6.17 ANALYSE DU MARCHÉ EN ITALIE PAR SOURCE
    18. 6.18 ANALYSE DU MARCHÉ EN ESPAGNE PAR PRODUIT
    19. 6.19 ANALYSE DU MARCHÉ EN ESPAGNE PAR SOURCE
    20. 6.20 ANALYSE DU MARCHÉ DANS LE RESTE DE L'EUROPE PAR PRODUIT
    21. 6.21 ANALYSE DU MARCHÉ DANS LE RESTE DE L'EUROPE PAR SOURCE
    22. 6.22 ANALYSE DU MARCHÉ EN APAC
    23. 6.23 ANALYSE DU MARCHÉ EN CHINE PAR PRODUIT
    24. 6.24 ANALYSE DU MARCHÉ EN CHINE PAR SOURCE
    25. 6.25 ANALYSE DU MARCHÉ EN INDE PAR PRODUIT
    26. 6.26 ANALYSE DU MARCHÉ EN INDE PAR SOURCE
    27. 6.27 ANALYSE DU MARCHÉ AU JAPON PAR PRODUIT
    28. 6.28 ANALYSE DU MARCHÉ AU JAPON PAR SOURCE
    29. 6.29 ANALYSE DU MARCHÉ EN CORÉE DU SUD PAR PRODUIT
    30. 6.30 ANALYSE DU MARCHÉ EN CORÉE DU SUD PAR SOURCE
    31. 6.31 ANALYSE DU MARCHÉ EN MALAYSIE PAR PRODUIT
    32. 6.32 ANALYSE DU MARCHÉ EN MALAYSIE PAR SOURCE
    33. 6.33 ANALYSE DU MARCHÉ EN THAÏLANDE PAR PRODUIT
    34. 6.34 ANALYSE DU MARCHÉ EN THAÏLANDE PAR SOURCE
    35. 6.35 ANALYSE DU MARCHÉ EN INDONÉSIE PAR PRODUIT
    36. 6.36 ANALYSE DU MARCHÉ EN INDONÉSIE PAR SOURCE
    37. 6.37 ANALYSE DU MARCHÉ DANS LE RESTE DE L'APAC PAR PRODUIT
    38. 6.38 ANALYSE DU MARCHÉ DANS LE RESTE DE L'APAC PAR SOURCE
    39. 6.39 ANALYSE DU MARCHÉ EN AMÉRIQUE DU SUD
    40. 6.40 ANALYSE DU MARCHÉ AU BRÉSIL PAR PRODUIT
    41. 6.41 ANALYSE DU MARCHÉ AU BRÉSIL PAR SOURCE
    42. 6.42 ANALYSE DU MARCHÉ AU MEXIQUE PAR PRODUIT
    43. 6.43 ANALYSE DU MARCHÉ AU MEXIQUE PAR SOURCE
    44. 6.44 ANALYSE DU MARCHÉ EN ARGENTINE PAR PRODUIT
    45. 6.45 ANALYSE DU MARCHÉ EN ARGENTINE PAR SOURCE
    46. 6.46 ANALYSE DU MARCHÉ DANS LE RESTE DE L'AMÉRIQUE DU SUD PAR PRODUIT
    47. 6.47 ANALYSE DU MARCHÉ DANS LE RESTE DE L'AMÉRIQUE DU SUD PAR SOURCE
    48. 6.48 ANALYSE DU MARCHÉ EN MEA
    49. 6.49 ANALYSE DU MARCHÉ DANS LES PAYS DU CCG PAR PRODUIT
    50. 6.50 ANALYSE DU MARCHÉ DANS LES PAYS DU CCG PAR SOURCE
    51. 6.51 ANALYSE DU MARCHÉ EN AFRIQUE DU SUD PAR PRODUIT
    52. 6.52 ANALYSE DU MARCHÉ EN AFRIQUE DU SUD PAR SOURCE
    53. 6.53 ANALYSE DU MARCHÉ DANS LE RESTE DE LA MEA PAR PRODUIT
    54. 6.54 ANALYSE DU MARCHÉ DANS LE RESTE DE LA MEA PAR SOURCE
    55. 6.55 CRITÈRES D'ACHAT CLÉS DES ALIMENTS, BOISSONS & NUTRITION
    56. 6.56 PROCESSUS DE RECHERCHE DE MRFR
    57. 6.57 ANALYSE DRO DE L'ALIMENTATION, DES BOISSONS & DE LA NUTRITION
    58. 6.58 ANALYSE D'IMPACT DES FACTEURS MOTRICES : ALIMENTATION, BOISSONS & NUTRITION
    59. 6.59 ANALYSE D'IMPACT DES CONTRAINTES : ALIMENTATION, BOISSONS & NUTRITION
    60. 6.60 CHAÎNE D'APPROVISIONNEMENT / DE VALEUR : ALIMENTATION, BOISSONS & NUTRITION
    61. 6.61 ALIMENTATION, BOISSONS & NUTRITION, PAR PRODUIT, 2024 (% PART)
    62. 6.62 ALIMENTATION, BOISSONS & NUTRITION, PAR PRODUIT, 2024 À 2035 (milliards USD)
    63. 6.63 ALIMENTATION, BOISSONS & NUTRITION, PAR SOURCE, 2024 (% PART)
    64. 6.64 ALIMENTATION, BOISSONS & NUTRITION, PAR SOURCE, 2024 À 2035 (milliards USD)
    65. 6.65 ÉVALUATION COMPARATIVE DES PRINCIPAUX CONCURRENTS
  7. 7 LISTE DES TABLEAUX
    1. 7.1 LISTE DES HYPOTHÈSES
  8. 7.1.1
    1. 7.2 ESTIMATIONS DE TAILLE DU MARCHÉ EN AMÉRIQUE DU NORD ; PRÉVISION
      1. 7.2.1 PAR PRODUIT, 2025-2035 (milliards USD)
      2. 7.2.2 PAR SOURCE, 2025-2035 (milliards USD)
    2. 7.3 ESTIMATIONS DE TAILLE DU MARCHÉ AUX ÉTATS-UNIS ; PRÉVISION
      1. 7.3.1 PAR PRODUIT, 2025-2035 (milliards USD)
      2. 7.3.2 PAR SOURCE, 2025-2035 (milliards USD)
    3. 7.4 ESTIMATIONS DE TAILLE DU MARCHÉ AU CANADA ; PRÉVISION
      1. 7.4.1 PAR PRODUIT, 2025-2035 (milliards USD)
      2. 7.4.2 PAR SOURCE, 2025-2035 (milliards USD)
    4. 7.5 ESTIMATIONS DE TAILLE DU MARCHÉ EN EUROPE ; PRÉVISION
      1. 7.5.1 PAR PRODUIT, 2025-2035 (milliards USD)
      2. 7.5.2 PAR SOURCE, 2025-2035 (milliards USD)
    5. 7.6 ESTIMATIONS DE TAILLE DU MARCHÉ EN ALLEMAGNE ; PRÉVISION
      1. 7.6.1 PAR PRODUIT, 2025-2035 (milliards USD)
      2. 7.6.2 PAR SOURCE, 2025-2035 (milliards USD)
    6. 7.7 ESTIMATIONS DE TAILLE DU MARCHÉ AU ROYAUME-UNI ; PRÉVISION
      1. 7.7.1 PAR PRODUIT, 2025-2035 (milliards USD)
      2. 7.7.2 PAR SOURCE, 2025-2035 (milliards USD)
    7. 7.8 ESTIMATIONS DE TAILLE DU MARCHÉ EN FRANCE ; PRÉVISION
      1. 7.8.1 PAR PRODUIT, 2025-2035 (milliards USD)
      2. 7.8.2 PAR SOURCE, 2025-2035 (milliards USD)
    8. 7.9 ESTIMATIONS DE TAILLE DU MARCHÉ EN RUSSIE ; PRÉVISION
      1. 7.9.1 PAR PRODUIT, 2025-2035 (milliards USD)
      2. 7.9.2 PAR SOURCE, 2025-2035 (milliards USD)
    9. 7.10 ESTIMATIONS DE TAILLE DU MARCHÉ EN ITALIE ; PRÉVISION
      1. 7.10.1 PAR PRODUIT, 2025-2035 (milliards USD)
      2. 7.10.2 PAR SOURCE, 2025-2035 (milliards USD)
    10. 7.11 ESTIMATIONS DE TAILLE DU MARCHÉ EN ESPAGNE ; PRÉVISION
      1. 7.11.1 PAR PRODUIT, 2025-2035 (milliards USD)
      2. 7.11.2 PAR SOURCE, 2025-2035 (milliards USD)
    11. 7.12 ESTIMATIONS DE TAILLE DU MARCHÉ DANS LE RESTE DE L'EUROPE ; PRÉVISION
      1. 7.12.1 PAR PRODUIT, 2025-2035 (milliards USD)
      2. 7.12.2 PAR SOURCE, 2025-2035 (milliards USD)
    12. 7.13 ESTIMATIONS DE TAILLE DU MARCHÉ EN APAC ; PRÉVISION
      1. 7.13.1 PAR PRODUIT, 2025-2035 (milliards USD)
      2. 7.13.2 PAR SOURCE, 2025-2035 (milliards USD)
    13. 7.14 ESTIMATIONS DE TAILLE DU MARCHÉ EN CHINE ; PRÉVISION
      1. 7.14.1 PAR PRODUIT, 2025-2035 (milliards USD)
      2. 7.14.2 PAR SOURCE, 2025-2035 (milliards USD)
    14. 7.15 ESTIMATIONS DE TAILLE DU MARCHÉ EN INDE ; PRÉVISION
      1. 7.15.1 PAR PRODUIT, 2025-2035 (milliards USD)
      2. 7.15.2 PAR SOURCE, 2025-2035 (milliards USD)
    15. 7.16 ESTIMATIONS DE TAILLE DU MARCHÉ AU JAPON ; PRÉVISION
      1. 7.16.1 PAR PRODUIT, 2025-2035 (milliards USD)
      2. 7.16.2 PAR SOURCE, 2025-2035 (milliards USD)
    16. 7.17 ESTIMATIONS DE TAILLE DU MARCHÉ EN CORÉE DU SUD ; PRÉVISION
      1. 7.17.1 PAR PRODUIT, 2025-2035 (milliards USD)
      2. 7.17.2 PAR SOURCE, 2025-2035 (milliards USD)
    17. 7.18 ESTIMATIONS DE TAILLE DU MARCHÉ EN MALAYSIE ; PRÉVISION
      1. 7.18.1 PAR PRODUIT, 2025-2035 (milliards USD)
      2. 7.18.2 PAR SOURCE, 2025-2035 (milliards USD)
    18. 7.19 ESTIMATIONS DE TAILLE DU MARCHÉ EN THAÏLANDE ; PRÉVISION
      1. 7.19.1 PAR PRODUIT, 2025-2035 (milliards USD)
      2. 7.19.2 PAR SOURCE, 2025-2035 (milliards USD)
    19. 7.20 ESTIMATIONS DE TAILLE DU MARCHÉ EN INDONÉSIE ; PRÉVISION
      1. 7.20.1 PAR PRODUIT, 2025-2035 (milliards USD)
      2. 7.20.2 PAR SOURCE, 2025-2035 (milliards USD)
    20. 7.21 ESTIMATIONS DE TAILLE DU MARCHÉ DANS LE RESTE DE L'APAC ; PRÉVISION
      1. 7.21.1 PAR PRODUIT, 2025-2035 (milliards USD)
      2. 7.21.2 PAR SOURCE, 2025-2035 (milliards USD)
    21. 7.22 ESTIMATIONS DE TAILLE DU MARCHÉ EN AMÉRIQUE DU SUD ; PRÉVISION
      1. 7.22.1 PAR PRODUIT, 2025-2035 (milliards USD)
      2. 7.22.2 PAR SOURCE, 2025-2035 (milliards USD)
    22. 7.23 ESTIMATIONS DE TAILLE DU MARCHÉ AU BRÉSIL ; PRÉVISION
      1. 7.23.1 PAR PRODUIT, 2025-2035 (milliards USD)
      2. 7.23.2 PAR SOURCE, 2025-2035 (milliards USD)
    23. 7.24 ESTIMATIONS DE TAILLE DU MARCHÉ AU MEXIQUE ; PRÉVISION
      1. 7.24.1 PAR PRODUIT, 2025-2035 (milliards USD)
      2. 7.24.2 PAR SOURCE, 2025-2035 (milliards USD)
    24. 7.25 ESTIMATIONS DE TAILLE DU MARCHÉ EN ARGENTINE ; PRÉVISION
      1. 7.25.1 PAR PRODUIT, 2025-2035 (milliards USD)
      2. 7.25.2 PAR SOURCE, 2025-2035 (milliards USD)
    25. 7.26 ESTIMATIONS DE TAILLE DU MARCHÉ DANS LE RESTE DE L'AMÉRIQUE DU SUD ; PRÉVISION
      1. 7.26.1 PAR PRODUIT, 2025-2035 (milliards USD)
      2. 7.26.2 PAR SOURCE, 2025-2035 (milliards USD)
    26. 7.27 ESTIMATIONS DE TAILLE DU MARCHÉ EN MEA ; PRÉVISION
      1. 7.27.1 PAR PRODUIT, 2025-2035 (milliards USD)
      2. 7.27.2 PAR SOURCE, 2025-2035 (milliards USD)
    27. 7.28 ESTIMATIONS DE TAILLE DU MARCHÉ DANS LES PAYS DU CCG ; PRÉVISION
      1. 7.28.1 PAR PRODUIT, 2025-2035 (milliards USD)
      2. 7.28.2 PAR SOURCE, 2025-2035 (milliards USD)
    28. 7.29 ESTIMATIONS DE TAILLE DU MARCHÉ EN AFRIQUE DU SUD ; PRÉVISION
      1. 7.29.1 PAR PRODUIT, 2025-2035 (milliards USD)
      2. 7.29.2 PAR SOURCE, 2025-2035 (milliards USD)
    29. 7.30 ESTIMATIONS DE TAILLE DU MARCHÉ DANS LE RESTE DE LA MEA ; PRÉVISION
      1. 7.30.1 PAR PRODUIT, 2025-2035 (milliards USD)
      2. 7.30.2 PAR SOURCE, 2025-2035 (milliards USD)
    30. 7.31 LANCEMENT DE PRODUIT/DÉVELOPPEMENT DE PRODUIT/APPROBATION
  9. 7.31.1
    1. 7.32 ACQUISITION/PARTENARIAT
  10. 7.32.1

Segmentation du marché

Perspectives des produits de cidre (milliards USD, 2018-2032)
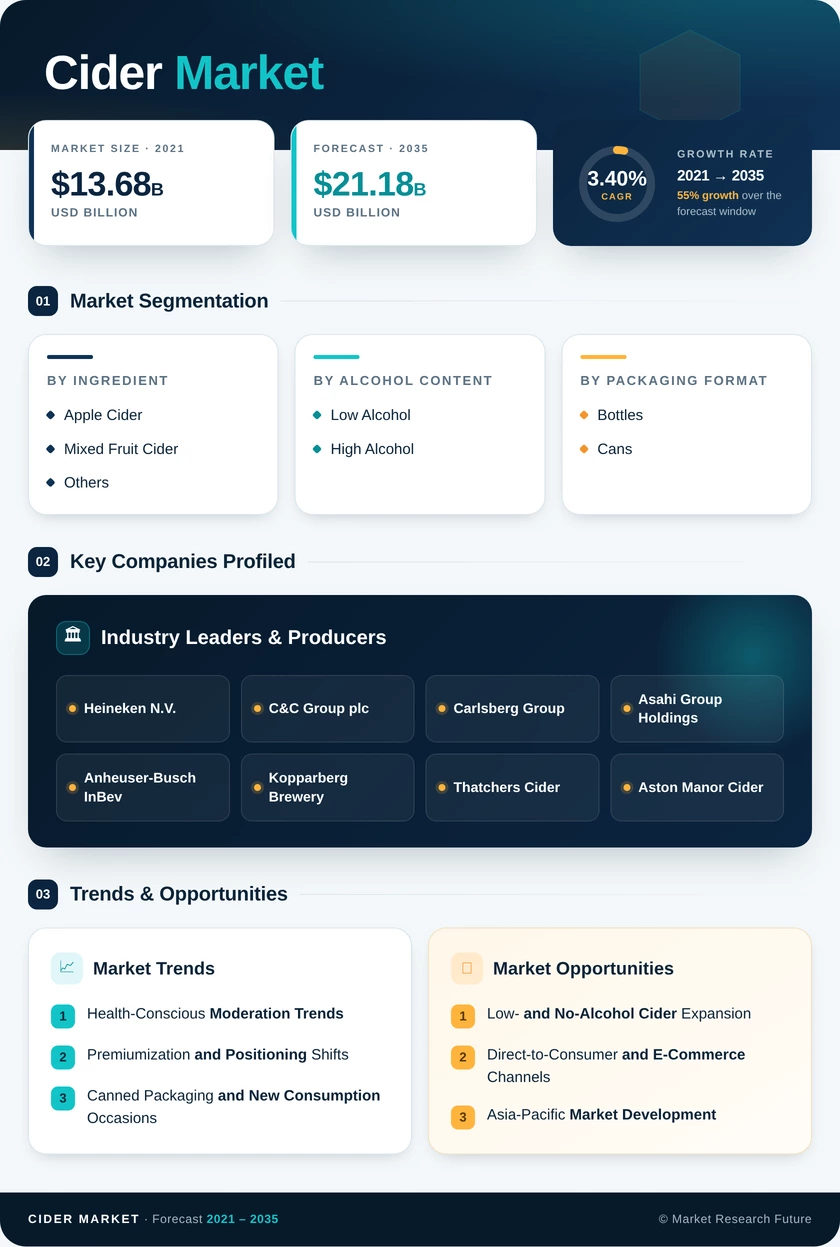
  • Cidre pétillant
  • Cidre tranquille
  • Vin de pomme

Perspectives des sources de cidre (milliards USD, 2018-2032)

  • Pomme
  • Arôme de fruit
  • Perry
  • Autres

Perspectives régionales du cidre (milliards USD, 2018-2032)

  • Perspectives de l'Amérique du Nord (milliards USD, 2018-2032)
    • Cidre en Amérique du Nord par produit
      • Cidre pétillant
      • Cidre tranquille
      • Vin de pomme
    • Cidre en Amérique du Nord par source
      • Pomme
      • Arôme de fruit
      • Perry
      • Autres
    • Perspectives des États-Unis (milliards USD, 2018-2032)
    • Cidre aux États-Unis par produit
      • Cidre pétillant
      • Cidre tranquille
      • Vin de pomme
    • Cidre aux États-Unis par source
      • Pomme
      • Arôme de fruit
      • Perry
      • Autres
    • Perspectives du CANADA (milliards USD, 2018-2032)
    • Cidre au CANADA par produit
      • Cidre pétillant
      • Cidre tranquille
      • Vin de pomme
    • Cidre au CANADA par source
      • Pomme
      • Arôme de fruit
      • Perry
      • Autres
    • Perspectives de l'Europe (milliards USD, 2018-2032)
      • Cidre en Europe par produit
        • Cidre pétillant
        • Cidre tranquille
        • Vin de pomme
      • Cidre en Europe par source
        • Pomme
        • Arôme de fruit
        • Perry
        • Autres
      • Allemagne Perspectives (milliards USD, 2018-2032)
      • Cidre en Allemagne par produit
        • Cidre pétillant
        • Cidre tranquille
        • Vin de pomme
      • Cidre en Allemagne par source
        • Pomme
        • Arôme de fruit
        • Perry
        • Autres
      • France Perspectives (milliards USD, 2018-2032)
      • Cidre en France par produit
        • Cidre pétillant
        • Cidre tranquille
        • Vin de pomme
      • Cidre en France par source
        • Pomme
        • Arôme de fruit
        • Perry
        • Autres
      • Royaume-Uni Perspectives (milliards USD, 2018-2032)
      • Cidre au Royaume-Uni par produit
        • Cidre pétillant
        • Cidre tranquille
        • Vin de pomme
      • Cidre au Royaume-Uni par source
        • Pomme
        • Arôme de fruit
        • Perry
        • Autres
      • ITALIE Perspectives (milliards USD, 2018-2032)
      • Cidre en ITALIE par produit
        • Cidre pétillant
        • Cidre tranquille
        • Vin de pomme
      • Cidre en ITALIE par source
        • Pomme
        • Arôme de fruit
        • Perry
        • Autres
      • ESPAGNE Perspectives (milliards USD, 2018-2032)
      • Cidre en Espagne par produit
        • Cidre pétillant
        • Cidre tranquille
        • Vin de pomme
      • Cidre en Espagne par source
        • Pomme
        • Arôme de fruit
        • Perry
        • Autres
      • Reste de l'Europe Perspectives (milliards USD, 2018-2032)
      • Cidre dans le reste de l'Europe par produit
        • Cidre pétillant
        • Cidre tranquille
        • Vin de pomme
      • Cidre dans le RESTE DE L'EUROPE par source
        • Pomme
        • Arôme de fruit
        • Perry
        • Autres
      • Perspectives de la région Asie-Pacifique (milliards USD, 2018-2032)
        • Cidre dans la région Asie-Pacifique par produit
          • Cidre pétillant
          • Cidre tranquille
          • Vin de pomme
        • Cidre dans la région Asie-Pacifique par source
          • Pomme
          • Arôme de fruit
          • Perry
          • Autres
        • Chine Perspectives (milliards USD, 2018-2032)
        • Cidre en Chine par produit
          • Cidre pétillant
          • Cidre tranquille
          • Vin de pomme
        • Cidre en Chine par source
          • Pomme
          • Arôme de fruit
          • Perry
          • Autres
        • Japon Perspectives (milliards USD, 2018-2032)
        • Cidre au Japon par produit
          • Cidre pétillant
          • Cidre tranquille
          • Vin de pomme
        • Cidre au Japon par source
          • Pomme
          • Arôme de fruit
          • Perry
          • Autres
        • Inde Perspectives (milliards USD, 2018-2032)
        • Cidre en Inde par produit
          • Cidre pétillant
          • Cidre tranquille
          • Vin de pomme
        • Cidre en Inde par source
          • Pomme
          • Arôme de fruit
          • Perry
          • Autres
        • Australie Perspectives (milliards USD, 2018-2032)
        • Cidre en Australie par produit
          • Cidre pétillant
          • Cidre tranquille
          • Vin de pomme
        • Cidre en Australie par source
          • Pomme
          • Arôme de fruit
          • Perry
          • Autres
        • Reste de la région Asie-Pacifique Perspectives (milliards USD, 2018-2032)
        • Cidre dans le reste de la région Asie-Pacifique par produit
          • Cidre pétillant
          • Cidre tranquille
          • Vin de pomme
        • Cidre dans le reste de la région Asie-Pacifique par source
          • Pomme
          • Arôme de fruit
          • Perry
          • Autres
        • Reste du monde Perspectives (milliards USD, 2018-2032)
          • Cidre dans le reste du monde par produit
            • Cidre pétillant
            • Cidre tranquille
            • Vin de pomme
          • Cidre dans le reste du monde par source
            • Pomme
            • Arôme de fruit
            • Perry
            • Autres
          • Perspectives du Moyen-Orient (milliards USD, 2018-2032)
          • Cidre au Moyen-Orient par produit
            • Cidre pétillant
            • Cidre tranquille
            • Vin de pomme
          • Cidre au Moyen-Orient par source
            • Pomme
            • Arôme de fruit
            • Perry
            • Autres
          • Perspectives de l'Afrique (milliards USD, 2018-2032)
          • Cidre en Afrique par produit
            • Cidre pétillant
            • Cidre tranquille
            • Vin de pomme
          • Cidre en Afrique par source
            • Pomme
            • Arôme de fruit
            • Perry
            • Autres
          • Perspectives de l'Amérique Latine (milliards USD, 2018-2032)
          • Cidre en Amérique Latine par produit
            • Cidre pétillant
            • Cidre tranquille
            • Vin de pomme
          • Cidre en Amérique Latine par source
            • Pomme
            • Arôme de fruit
            • Perry
            • Autres

Compare Licence

×
Features License Type
Single User Multiuser License Enterprise User
Price $4,950 $5,950 $7,250
Maximum User Access Limit 1 User Upto 10 Users Unrestricted Access Throughout the Organization
Free Customization
Direct Access to Analyst
Deliverable Format
Platform Access
Discount on Next Purchase 10% 15% 15%
Printable Versions