Segmentación del mercado
Producto y software empresarial de atención médica Perspectivas de Servicios (Miles de millones de USD, 2018-2032)
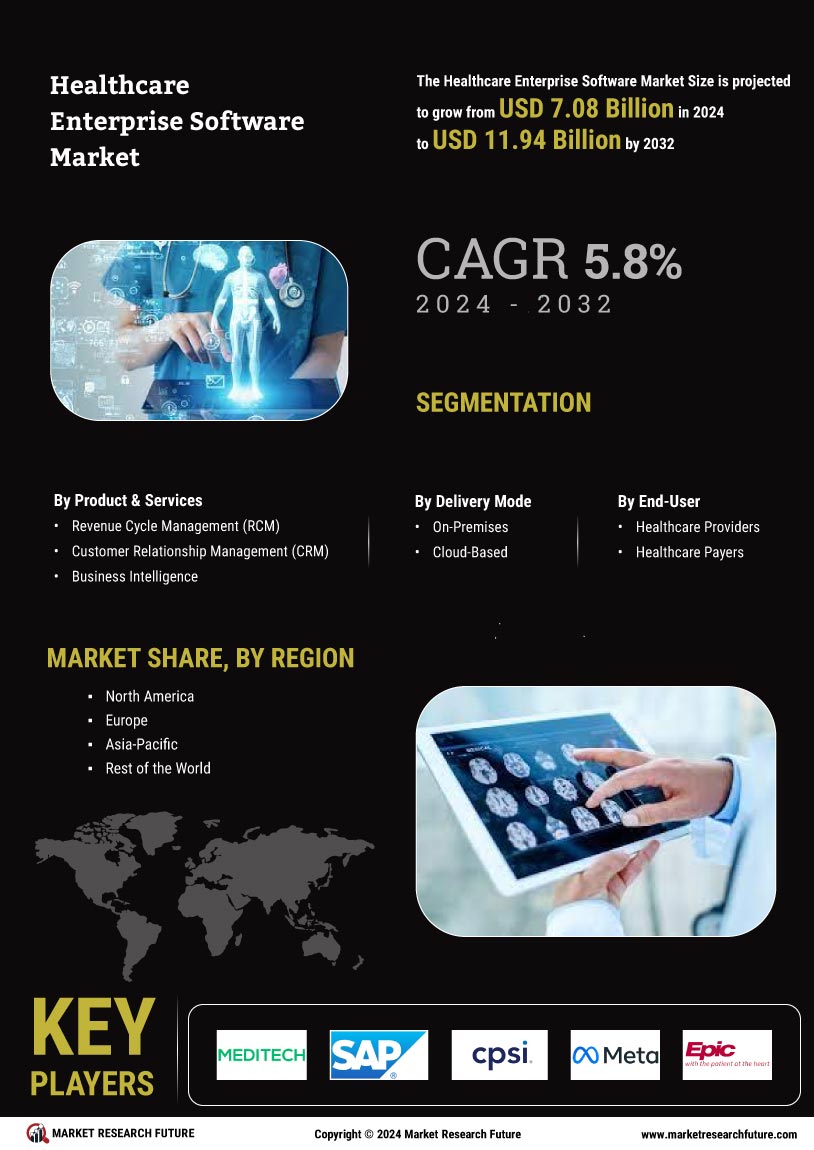
Gestión del Ciclo de Ingresos (RCM)
Gestión de la Relación con el Cliente (CRM)
Inteligencia Empresarial
Gestión de Contenido Empresarial
Perspectivas del Modo de Entrega de Software Empresarial para el Sector Salud (Miles de millones de USD, 2018-2032)
Local
En la Nube
Perspectivas del Usuario Final de Software Empresarial para el Sector Salud (Miles de millones de USD, 2018-2032)
Proveedores de Servicios de Salud
Servicios de Salud Pagadores
Perspectiva regional del software empresarial de salud (miles de millones de USD, 2018-2032)
-
Perspectivas de América del Norte (miles de millones de USD, 2018-2032)
-
Software empresarial de atención médica en América del Norte por producto y Servicios
Gestión del Ciclo de Ingresos (RCM)
Gestión de la Relación con el Cliente (CRM)
Inteligencia Empresarial
Gestión de Contenido Empresarial
-
Software Empresarial de Salud en Norteamérica por Modo de Entrega
Local
En la Nube
-
Software Empresarial de Salud en Norteamérica por Usuario Final
Proveedores de Servicios de Salud
Pagadores de Servicios de Salud
EE. UU. Perspectivas (miles de millones de USD, 2018-2032)
-
Software empresarial de atención médica de EE. UU. por producto y Servicios
Gestión del Ciclo de Ingresos (RCM)
Gestión de la Relación con el Cliente (CRM)
Inteligencia Empresarial
Gestión de Contenido Empresarial
-
Software Empresarial de Salud en EE. UU. por Modo de Entrega
Local
En la Nube
-
Software Empresarial de Salud en EE. UU. por Usuario Final
Proveedores de Servicios de Salud
Pagadores de Servicios de Salud
Canadá Perspectivas (miles de millones de USD, 2018-2032)
-
Software empresarial de atención médica de Canadá por producto y Servicios
Gestión del Ciclo de Ingresos (RCM)
Gestión de la Relación con el Cliente (CRM)
Inteligencia Empresarial
Gestión de Contenido Empresarial
-
Software Empresarial de Salud en Canadá por Modo de Entrega
Local
En la Nube
-
Software Empresarial de Salud en Canadá por Usuario Final
Proveedores de Servicios de Salud
Servicios de Salud Pagadores
-
-
Perspectivas para Europa (miles de millones de USD, 2018-2032)
-
Software empresarial de atención médica en Europa por producto y Servicios
Gestión del Ciclo de Ingresos (RCM)
Gestión de la Relación con el Cliente (CRM)
Inteligencia Empresarial
Gestión de Contenido Empresarial
-
Software Empresarial de Salud en Europa por Modo de Entrega
Local
En la Nube
-
Software Empresarial de Salud en Europa por Usuario Final
Proveedores de Servicios de Salud
Salud Pagadores
Alemania Perspectivas (miles de millones de USD, 2018-2032)
-
Software empresarial de atención médica en Alemania por producto y Servicios
Gestión del Ciclo de Ingresos (RCM)
Gestión de la Relación con el Cliente (CRM)
Inteligencia Empresarial
Gestión de Contenido Empresarial
-
Software Empresarial de Salud en Alemania por Modo de Entrega
Local
En la Nube
-
Software Empresarial de Salud en Alemania por Usuario Final
Proveedores de Servicios de Salud
Pagadores de Servicios de Salud
Perspectivas de Francia (USD) Miles de millones, 2018-2032)
-
Software empresarial de atención médica en Francia por producto y Servicios
Gestión del Ciclo de Ingresos (RCM)
Gestión de la Relación con el Cliente (CRM)
Inteligencia Empresarial
Gestión de Contenido Empresarial
-
Software Empresarial de Atención Médica en Francia por Modo de Entrega
Local
En la Nube
-
Software Empresarial de Atención Médica en Francia por Usuario Final
Proveedores de Servicios de Salud
Pagadores de Servicios de Salud
Reino Unido Perspectivas (miles de millones de USD, 2018-2032)
-
Software empresarial de atención médica del Reino Unido por producto y Servicios
Gestión del Ciclo de Ingresos (RCM)
Gestión de la Relación con el Cliente (CRM)
Inteligencia Empresarial
Gestión de Contenido Empresarial
-
Software Empresarial de Salud en el Reino Unido por Modo de Entrega
Local
En la Nube
-
Software Empresarial de Salud en el Reino Unido por Usuario Final
Proveedores de Servicios de Salud
Pagadores de Servicios de Salud
Italia Perspectivas (miles de millones de USD, 2018-2032)
-
Software empresarial de atención médica en Italia por producto y Servicios
Gestión del Ciclo de Ingresos (RCM)
Gestión de la Relación con el Cliente (CRM)
Inteligencia Empresarial
Gestión de Contenido Empresarial
-
Software Empresarial de Salud en Italia por Modo de Entrega
Local
En la Nube
-
Software Empresarial de Salud en Italia por Usuario Final
Proveedores de Servicios de Salud
Pagadores de Servicios de Salud
España Perspectivas (miles de millones de USD, 2018-2032)
-
Software empresarial sanitario en España por producto y Servicios
Gestión del Ciclo de Ingresos (RCM)
Gestión de la Relación con el Cliente (CRM)
Inteligencia Empresarial
Gestión de Contenido Empresarial
-
Software Empresarial de Salud en España por Modo de Entrega
Local
En la Nube
-
Software Empresarial de Salud en España por Usuario Final
Proveedores de Servicios Sanitarios
Pagadores de Servicios Sanitarios
Resto de Europa Perspectivas (miles de millones de USD, 2018-2032)
-
Software empresarial de atención médica en el resto de Europa por producto y Servicios
Gestión del Ciclo de Ingresos (RCM)
Gestión de la Relación con el Cliente (CRM)
Inteligencia Empresarial
Gestión de Contenido Empresarial
-
Software Empresarial de Salud en el Resto de Europa por Modo de Entrega
Local
En la Nube
-
Software Empresarial de Salud en el Resto de Europa por Usuario Final
Proveedores de Servicios de Salud
Servicios de Salud Pagadores
-
-
Perspectivas de Asia-Pacífico (miles de millones de USD, 2018-2032)
-
Software empresarial de atención médica en Asia-Pacífico por producto y Servicios
Gestión del Ciclo de Ingresos (RCM)
Gestión de la Relación con el Cliente (CRM)
Inteligencia Empresarial
Gestión de Contenido Empresarial
-
Software Empresarial de Salud en Asia-Pacífico por Modo de Entrega
Local
En la Nube
-
Software Empresarial de Salud en Asia-Pacífico por Usuario Final
Proveedores de Servicios de Salud
Servicios de Salud Pagadores
Perspectivas de China(Miles de millones de USD, 2018-2032)
-
Software empresarial de atención médica en China por producto y Servicios
Gestión del Ciclo de Ingresos (RCM)
Gestión de la Relación con el Cliente (CRM)
Inteligencia Empresarial
Gestión de Contenido Empresarial
-
Software Empresarial de Salud en China por Modo de Entrega
Local
En la Nube
-
Software Empresarial de Salud en China por Usuario Final
Proveedores de Servicios de Salud
Pagadores de Servicios de Salud
Japón Perspectivas (miles de millones de USD, 2018-2032)
-
Software empresarial de atención médica en Japón por producto y Servicios
Gestión del Ciclo de Ingresos (RCM)
Gestión de la Relación con el Cliente (CRM)
Inteligencia Empresarial
Gestión de Contenido Empresarial
-
Software Empresarial de Salud en Japón por Modo de Entrega
Local
En la Nube
-
Software Empresarial de Salud en Japón por Usuario Final
Proveedores de Servicios de Salud
Pagadores de Servicios de Salud
India Perspectivas (miles de millones de USD, 2018-2032)
-
Software empresarial de atención médica en India por producto y Servicios
Gestión del Ciclo de Ingresos (RCM)
Gestión de la Relación con el Cliente (CRM)
Inteligencia Empresarial
Gestión de Contenido Empresarial
-
Software Empresarial de Salud en India por Modo de Entrega
Local
En la Nube
-
Software Empresarial de Salud en India por Usuario Final
Proveedores de Servicios de Salud
Pagadores de Servicios de Salud
Australia Perspectivas (miles de millones de USD, 2018-2032)
-
Software empresarial de atención médica en Australia por producto y Servicios
Gestión del Ciclo de Ingresos (RCM)
Gestión de la Relación con el Cliente (CRM)
Inteligencia Empresarial
Gestión de Contenido Empresarial
-
Software Empresarial de Salud en Australia por Modo de Entrega
Local
En la Nube
-
Software Empresarial de Salud en Australia por Usuario Final
Proveedores de Servicios de Salud
Servicios de Salud Pagadores
Perspectivas para el resto de Asia-Pacífico (miles de millones de USD, 2018-2032)
-
Software empresarial de atención médica para el resto de Asia-Pacífico por producto y Servicios
Gestión del Ciclo de Ingresos (RCM)
Gestión de la Relación con el Cliente (CRM)
Inteligencia Empresarial
Gestión de Contenido Empresarial
-
Resto de Software Empresarial de Salud en Asia-Pacífico por Modo de Entrega
Local
En la Nube
-
Resto de Software Empresarial de Salud en Asia-Pacífico por Usuario Final
Proveedores de Servicios de Salud
Servicios de Salud Pagadores
-
-
Perspectivas para el resto del mundo (miles de millones de USD, 2018-2032)
-
Software empresarial de atención médica para el resto del mundo por producto y Servicios
Gestión del Ciclo de Ingresos (RCM)
Gestión de la Relación con el Cliente (CRM)
Inteligencia Empresarial
Gestión de Contenido Empresarial
-
Software Empresarial para el Sector Salud del Resto del Mundo por Modo de Entrega
Local
En la Nube
-
Software Empresarial para el Sector Salud del Resto del Mundo por Usuario Final
Proveedores de Servicios de Salud
Servicios de Salud Pagadores
Perspectivas para Oriente Medio (miles de millones de USD, 2018-2032)
-
Software empresarial de atención médica para Oriente Medio por producto y Servicios
Gestión del Ciclo de Ingresos (RCM)
Gestión de la Relación con el Cliente (CRM)
Inteligencia Empresarial
Gestión de Contenido Empresarial
-
Software Empresarial de Salud en Oriente Medio por Modo de Entrega
Local
En la Nube
-
Software Empresarial de Salud en Oriente Medio por Usuario Final
Proveedores de Servicios de Salud
Pagadores de Servicios de Salud
África Perspectivas (miles de millones de USD, 2018-2032)
-
Software empresarial de atención médica en África por producto y Servicios
Gestión del Ciclo de Ingresos (RCM)
Gestión de la Relación con el Cliente (CRM)
Inteligencia Empresarial
Gestión de Contenido Empresarial
-
Software Empresarial de Salud en África por Modo de Entrega
Local
En la Nube
-
Software Empresarial de Salud en África por Usuario Final
Proveedores de Servicios de Salud
Pagadores de Servicios de Salud
América Latina Perspectivas (miles de millones de USD, 2018-2032)
-
Software empresarial de atención médica en América Latina por producto y Servicios
Gestión del Ciclo de Ingresos (RCM)
Gestión de la Relación con el Cliente (CRM)
Inteligencia de Negocios
Gestión de Contenido Empresarial
-
Software Empresarial de Salud en América Latina por Modo de Entrega
Local
En la Nube
-
Software Empresarial de Salud en América Latina por Usuario Final
Proveedores de Servicios de Salud
Pagadores de Servicios de Salud
-