Segmentación del mercado de ciencias biológicas
Ciencias biológicas por tipo de residuo (USD Miles de millones, 2025-2035)
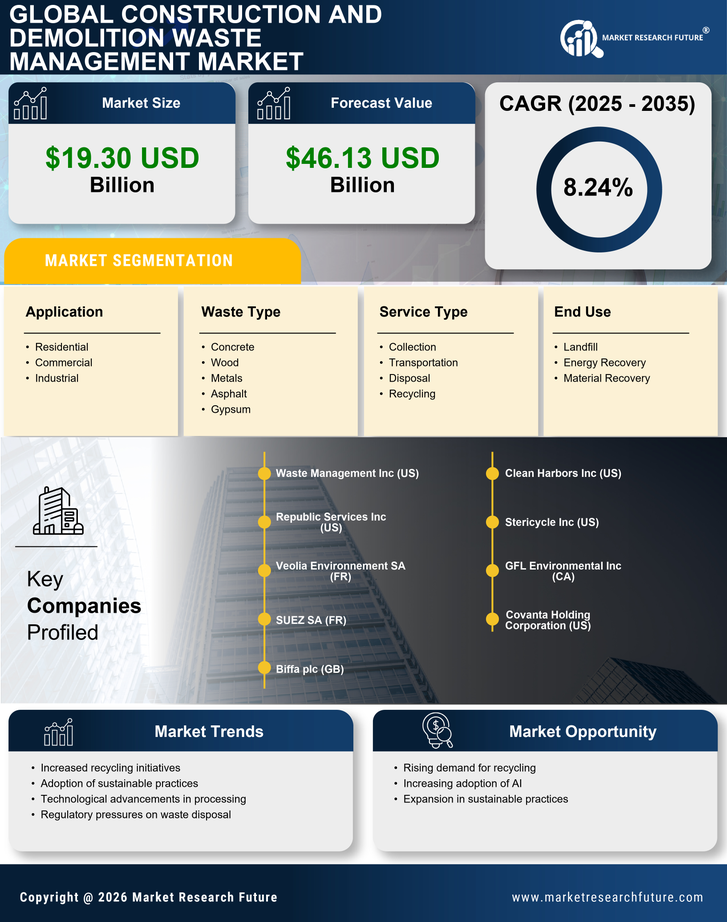
- Concreto
- Madera
- Rieles
- Asfalto
- Yeso
Ciencias biológicas por tipo de servicio (USD mil millones, 2025-2035)
- Recopilación
- Transporte
- Desecho
- Reciclaje
Ciencias biológicas por aplicación (USD Mil millones, 2025-2035)
- Residencial
- Comercial
- Industrial
Ciencias biológicas por uso final (USD mil millones, 2025-2035)
- Vertedero
- Recuperación de energía
- Recuperación de Materiales