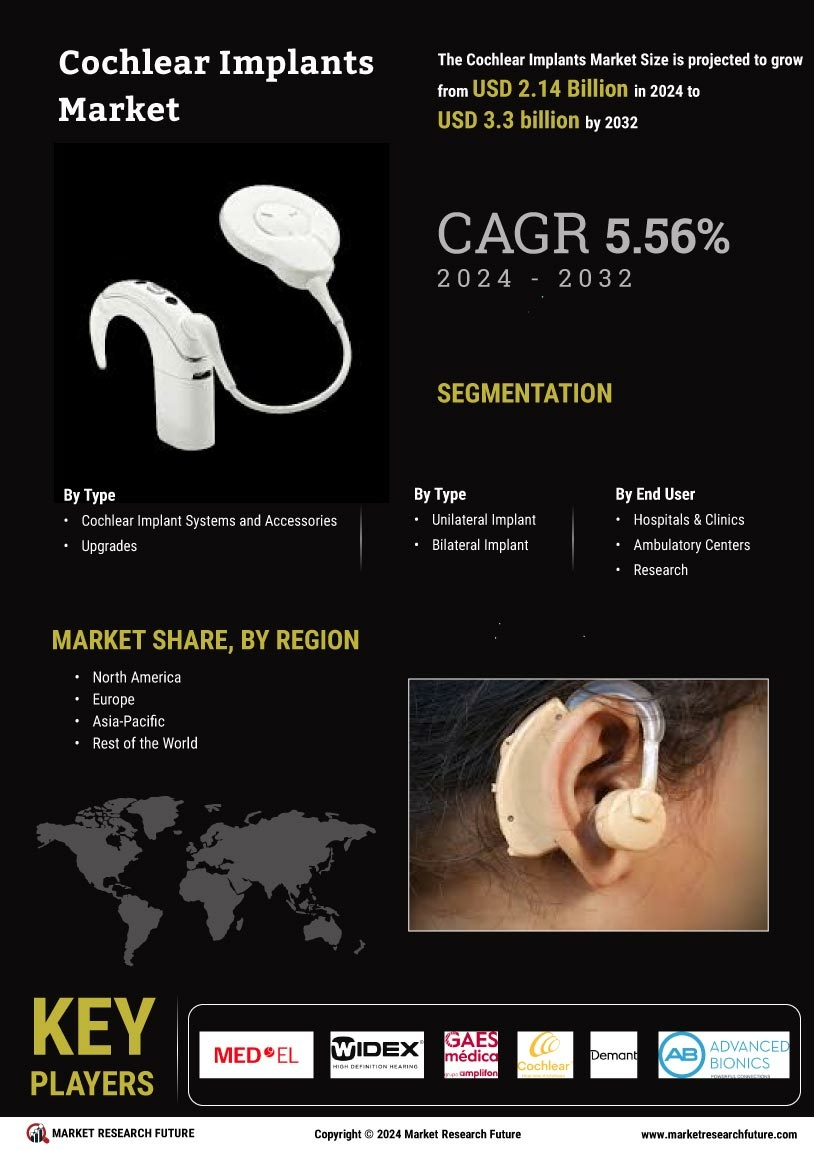
Cochlear Implants Market
Market Size
Key Players
- Technological Advancements
- Increased Awareness
- Personalized Solutions
- Growing Geriatric Population
- Increased Awareness and Education
- Rising Prevalence of Hearing Loss
- 1 Prólogo del informe
-
2 Introducción al mercado
- 2.1 Definición 14
- 2.2 Alcance del estudio 14
- 2.3 Objetivo de la investigación 14
-
2.4 Supuestos y objetivos Limitaciones 14
- 2.4.1 Supuestos 14
- 2.4.2 Limitaciones 14
- 2.5 Estructura del mercado 15
- 3 Metodología de investigación
- 3.1.1 Metodología de investigación primaria 17
- 3.1.2 Metodología de investigación secundaria 18
- 3.1.3 Análisis de participación de mercado 18
- 3.1.4 Enfoque de fijación de precios de mercado
-
4 Dinámica del mercado
- 4.1 Introducción 20
-
4.2 Conductores 21
- 4.2.1 Aumento del número de pacientes que sufren pérdida auditiva (peso 37%) 21
- 4.2.2 Aumento de la población geriátrica (peso 28%) 22
- 4.2.3 Aceptación de los implantes auditivos por parte de los pacientes con trastornos auditivos (peso 22%) 23
- 4.2.4 Políticas de reembolso favorables (ponderación 13%) 24
-
4.3 Restricciones 25
- 4.3.1 Alto costo de los dispositivos 25
- 4.4 Oportunidad 26
- 4.5 Tendencias 26
-
5 Mercado de implantes cocleares, por producto
- 5.1 Introducción 27
- 5.2 Sistema de implante coclear 28
- 5.3 Accesorios y accesorios Actualizaciones
-
6 Mercado de implantes cocleares, por tipo
- 6.1 Introducción 30
- 6.2 Implantes unilaterales 31
- 6.3 Implante bilateral 32
-
7 Mercado de implantes cocleares, al final Usuario
- 7.1 Introducción 33
- 7.2 Hospitales y hospitales Clínicas 34
- 7.3 Centros de cirugía ambulatoria 35
- 7.4 Investigación y desarrollo Institutos académicos 36
-
8 Mercado mundial de implantes cocleares, por región
- 8.1 Introducción 37
-
8.2 América 39
-
8.2.1 América del Norte 41
- 8.2.1.1 EE.UU. 43
- 8.2.1.2 Canadá 44
- 8.2.2 América del Sur 45
-
8.2.1 América del Norte 41
- Mercado de implantes cocleares, por producto
- Mercado de implantes cocleares, por Tipo
- Mercado de implantes cocleares, por usuario final
- Mercado de implantes cocleares, por producto
- Mercado de implantes cocleares, por tipo
- Mercado de implantes cocleares, por final Usuario
- Mercado de implantes cocleares, por producto
- Mercado de implantes cocleares, por tipo
- Mercado de implantes cocleares, por usuario final
- Mercado de implantes cocleares, por producto
- Mercado de implantes cocleares, por tipo
- Mercado de implantes cocleares, por usuario final
- Mercado de implantes cocleares, por Producto
- Mercado de implantes cocleares, por tipo
- Mercado de implantes cocleares, por usuario final
-
8.3 Europa 47
-
8.3.1 Europa occidental 49
- 8.3.1.1 Alemania 51
- 8.3.1.2 Francia 52
- 8.3.1.3 Reino Unido 53
- 8.3.1.4 Italia 54
- 8.3.1.5 España 55
- 8.3.1.6 Resto de Europa Occidental 56
- 8.3.2 Europa del Este 57
-
8.3.1 Europa occidental 49
- Mercado de implantes cocleares, por producto
- Mercado de implantes cocleares, por Tipo
- Mercado de implantes cocleares, por usuario final
- Mercado de implantes cocleares, por producto
- Mercado de implantes cocleares, por tipo
- Mercado de implantes cocleares, por final Usuario
- Mercado de implantes cocleares, por producto
- Mercado de implantes cocleares, por tipo
- Mercado de implantes cocleares, por usuario final
- Mercado de implantes cocleares, por producto
- Mercado de implantes cocleares, por tipo
- Mercado de implantes cocleares, por usuario final
- Mercado de implantes cocleares, por Producto
- Mercado de implantes cocleares, por tipo
- Mercado de implantes cocleares, por usuario final
- Mercado de implantes cocleares, por producto
- Mercado de implantes cocleares, por Tipo
- Mercado de implantes cocleares, por usuario final
- Mercado de implantes cocleares, por producto
- Mercado de implantes cocleares, por tipo
- Mercado de implantes cocleares, por final Usuario
- Mercado de implantes cocleares, por producto
- Mercado de implantes cocleares, por tipo
- Mercado de implantes cocleares, por usuario final
- Mercado de implantes cocleares, por producto
- Mercado de implantes cocleares, por tipo
- Mercado de implantes cocleares, por usuario final
-
8.4 Asia Pacífico 59
- 8.4.1 Japón 61
- 8.4.2 China 62
- 8.4.3 India 63
- 8.4.4 Australia 64
- 8.4.5 República de Corea 65
- 8.4.6 Resto de Asia Pacífico 66
- Mercado de implantes cocleares, por Producto
- Mercado de implantes cocleares, por tipo
- Mercado de implantes cocleares, por usuario final
- Mercado de implantes cocleares, por producto
- Mercado de implantes cocleares, por Tipo
- Mercado de implantes cocleares, por usuario final
- Mercado de implantes cocleares, por producto
- Mercado de implantes cocleares, por tipo
- Mercado de implantes cocleares, por final Usuario
- Mercado de implantes cocleares, por producto
- Mercado de implantes cocleares, por tipo
- Mercado de implantes cocleares, por usuario final
- Mercado de implantes cocleares, por producto
- Mercado de implantes cocleares, por tipo
- Mercado de implantes cocleares, por usuario final
- Mercado de implantes cocleares, por Producto
- Mercado de implantes cocleares, por tipo
- Mercado de implantes cocleares, por usuario final
- Mercado de implantes cocleares, por producto
- Mercado de implantes cocleares, por Tipo
- Mercado de implantes cocleares, por usuario final
-
8.5 Oriente Medio y Europa África 68
- 8.5.1 Emiratos Árabes Unidos 71
- 8.5.2 Arabia Saudita 72
- 8.5.3 Omán 73
- 8.5.4 Kuwait 74
- 8.5.5 Qatar 75
- 8.5.6 Resto de Oriente Medio y Europa África 76
- Mercado de implantes cocleares, por producto
- Mercado de implantes cocleares, por tipo
- Mercado de implantes cocleares, por usuario final
- Mercado de implantes cocleares, por Producto
- Mercado de implantes cocleares, por tipo
- Mercado de implantes cocleares, por usuario final
- Mercado de implantes cocleares, por producto
- Mercado de implantes cocleares, por Tipo
- Mercado de implantes cocleares, por usuario final
- Mercado de implantes cocleares, por producto
- Mercado de implantes cocleares, por tipo
- Mercado de implantes cocleares, por final Usuario
- Mercado de implantes cocleares, por producto
- Mercado de implantes cocleares, por tipo
- Mercado de implantes cocleares, por usuario final
- Mercado de implantes cocleares, por producto
- Mercado de implantes cocleares, por tipo
- Mercado de implantes cocleares, por usuario final
- Mercado de implantes cocleares, por producto
- Mercado de implantes cocleares, por tipo
- Mercado de implantes cocleares, por usuario final
-
9 Panorama empresarial
- 9.1 Introducción 78
- 9.2 Análisis de acciones de la empresa 78
- 9.3 Desarrollos clave 79
-
10 perfiles de la empresa
-
10.1 Advanced Bionics AG 80
- 10.1.1 Descripción general de la empresa 80
- 10.1.2 Finanzas 80
- 10.1.3 Productos 80
- 10.1.4 Estrategia 80
- 10.1.5 Desarrollos clave 80
-
10.2 MED-EL 81
- 10.2.1 Descripción general de la empresa 81
- 10.2.2 Finanzas 81
- 10.2.3 Productos 81
- 10.2.4 Estrategia 81
- 10.2.5 Desarrollos clave 81
-
10.3 Cochlear Ltd 82
- 10.3.1 Descripción general de la empresa 82
- 10.3.2 Finanzas 82
- 10.3.3 Productos 82
- 10.3.4 Estrategia 82
- 10.3.5 Desarrollos clave 82
-
10.4 GAES MÉDICA 83
- 10.4.1 Descripción general de la empresa 83
- 10.4.2 Finanzas 83
- 10.4.3 Productos 83
- 10.4.4 Estrategia 83
- 10.4.5 Desarrollos clave 83
-
10.5 William Demant Holding Group 84
- 10.5.1 Descripción general de la empresa 84
- 10.5.2 Finanzas 84
- 10.5.3 Productos 84
- 10.5.4 Estrategia 84
- 10.5.5 Desarrollos clave 84
-
10.6 Widex 85
- 10.6.1 Descripción general de la empresa 85
- 10.6.2 Finanzas 85
- 10.6.3 Productos 85
- 10.6.4 Estrategia 85
- 10.6.5 Desarrollos clave 85
-
10.7 Microson S.A. 86
- 10.7.1 Descripción general de la empresa 86
- 10.7.2 Finanzas 86
- 10.7.3 Productos 86
- 10.7.4 Estrategia 86
- 10.7.5 Desarrollos clave 86
-
10.1 Advanced Bionics AG 80
-
11 Conclusión
-
11.1 Hallazgos clave 87
- 11.1.1 Punto de vista del director ejecutivo 87
- 11.1.2 Necesidades insatisfechas 87
- 11.1.3 Empresas clave a tener en cuenta
-
11.1 Hallazgos clave 87
-
12 Apéndice
- 12.1 Modelo de discusión 88
- 12.2 Referencias
-
13 Lista de tablas
- TABLA 1 ENTREVISTAS PRINCIPALES 17
- TABLA 2 MERCADO MUNDIAL DE IMPLANTES COCLEARES POR PRODUCTO, 2022 HASTA 2030 (MILLONES DE USD) 27
- TABLA 3 MERCADO MUNDIAL DE IMPLANTES COCLEARES PARA EL SISTEMA DE IMPLANTES COCLEARES, POR REGIÓN, 2022 A 2030 (MILLONES DE USD) 28
- TABLA 4 MERCADO MUNDIAL DE IMPLANTES COCLEARES PARA ACCESORIOS Y DISPOSITIVOS ACTUALIZACIONES, POR REGIÓN, 2022 A 2030 (MILLONES DE USD) 29
- TABLA 5 MERCADO MUNDIAL DE IMPLANTES COCLEARES POR TIPO, 2022 A 2030 (MILLONES DE USD) 30
- TABLA 6 MERCADO MUNDIAL DE IMPLANTES COCLEARES PARA UNILATERAL IMPLANTE, POR REGIÓN, 2022 A 2030 (MILLONES DE USD) 31
- TABLA 7 MERCADO MUNDIAL DE IMPLANTES COCLEARES PARA IMPLANTES BILATERALES, POR REGIÓN, 2022 A 2030 (MILLONES DE USD) 32
- TABLA 8 MERCADO MUNDIAL DE IMPLANTES COCLEARES POR USUARIO FINAL, 2022 A 2030 (MILLONES DE USD) 34
- TABLA 9 MERCADO MUNDIAL DE IMPLANTES COCLEARES PARA HOSPITALES, POR REGIÓN, 2022 A 2030 (MILLONES DE USD) 34
- TABLA 10 MERCADO MUNDIAL DE IMPLANTES COCLEARES PARA AMBULATORIOS CENTROS QUIRÚRGICOS, POR REGIÓN, 2022 A 2030 (MILLONES DE USD) 35
- TABLA 11 MERCADO MUNDIAL DE IMPLANTES COCLEARES PARA INVESTIGACIÓN Y OBTENCIÓN. INSTITUTOS ACADÉMICOS, POR REGIÓN, 2022 A 2030 (MILLONES DE USD) 36
- TABLA 12 MERCADO MUNDIAL DE IMPLANTES COCLEARES POR REGIÓN, 2022 A 2030 (MILLONES DE USD) 38
- TABLA 13 MERCADO DE IMPLANTES COCLEARES EN AMÉRICAS POR REGIÓN, 2022 A 2030 (MILLONES DE USD) 39
- TABLA 14 MERCADO DE IMPLANTES COCLEARES EN AMÉRICAS POR PRODUCTO, 2022 A 2030 (MILLONES DE USD) 40
- TABLA 15 MERCADO DE IMPLANTES COCLEARES EN AMÉRICAS POR TIPO, 2022 A 2030 (MILLONES DE USD) 40
- TABLA 16 MERCADO DE IMPLANTES COCLEARES EN AMÉRICA POR USUARIO FINAL, 2022 A 2030 (MILLONES DE USD) 40
- TABLA 17 MERCADO DE IMPLANTES COCLEARES EN AMÉRICA DEL NORTE POR PAÍS, 2022 A 2030 (MILLONES DE USD) 41
- TABLA 18 MERCADO DE IMPLANTES COCLEARES DE AMÉRICA DEL NORTE POR PRODUCTO, 2022 A 2030 (MILLONES DE USD) 41
- TABLA 19 MERCADO DE IMPLANTES COCLEARES DE AMÉRICA DEL NORTE POR TIPO, 2022 A 2030 (MILLONES DE USD) 42
- TABLA 20 MERCADO DE IMPLANTES COCLEARES DE AMÉRICA DEL NORTE POR USUARIO FINAL, 2022 A 2030 (MILLONES DE USD) 42
- TABLA 21 MERCADO DE IMPLANTES COCLEARES DE EE. UU. POR PRODUCTO, 2022 A 2030 (MILLONES DE USD) 43
- TABLA 22 MERCADO DE IMPLANTES COCLEARES DE EE. UU. POR TIPO, 2022 A 2030 (MILLONES DE USD) 43
- TABLA 23 MERCADO DE IMPLANTES COCLEARES DE EE. UU. POR USUARIO FINAL, 2022 A 2030 (MILLONES DE USD) 43
- TABLA 24 MERCADO DE IMPLANTES COCLEARES DE CANADÁ POR PRODUCTO, 2022 A 2030 (MILLONES DE USD) 44
- TABLA 25 MERCADO DE IMPLANTES COCLEARES DE CANADÁ POR TIPO, 2022 A 2030 (MILLONES DE USD) 44
- TABLA 26 MERCADO DE IMPLANTES COCLEARES EN CANADÁ POR USUARIO FINAL, 2022 A 2030 (MILLONES DE USD) 44
- TABLA 27 MERCADO DE IMPLANTES COCLEARES EN AMÉRICA DEL SUR POR PRODUCTO, 2022 A 2030 (MILLONES DE USD) 45
- TABLA 28 MERCADO DE IMPLANTES COCLEARES EN AMÉRICA DEL SUR POR TIPO, 2022 A 2030 (MILLONES DE USD) 45
- TABLA 29 MERCADO DE IMPLANTES COCLEARES EN AMÉRICA DEL SUR POR USUARIO FINAL, 2022 A 2030 (MILLONES DE USD) 46
- TABLA 30 MERCADO DE IMPLANTES COCLEARES EN EUROPA POR REGIÓN, 2022 A 2030 (MILLONES DE USD) 47
- TABLA 31 MERCADO DE IMPLANTES COCLEARES EN EUROPA POR PRODUCTO, 2022 A 2030 (MILLONES DE USD) 48
- TABLA 32 MERCADO DE IMPLANTES COCLEARES EN EUROPA POR TIPO, 2022 A 2030 (MILLONES DE USD) 48
- TABLA 33 MERCADO DE IMPLANTES COCLEARES EN EUROPA POR USUARIO FINAL, 2022 A 2030 (MILLONES DE USD) 48
- TABLA 34 MERCADO DE IMPLANTES COCLEARES DE EUROPA OCCIDENTAL POR PAÍS, 2022 A 2030 (MILLONES DE USD) 49
- TABLA 35 MERCADO DE IMPLANTES COCLEARES DE EUROPA OCCIDENTAL POR PRODUCTO, 2022 A 2030 (MILLONES DE USD) 50
- TABLA 36 MERCADO DE IMPLANTES COCLEARES DE EUROPA OCCIDENTAL POR TIPO, 2022 A 2030 (MILLONES DE USD) 50
- TABLA 37 MERCADO DE IMPLANTES COCLEARES DE EUROPA OCCIDENTAL POR USUARIO FINAL, 2022 A 2030 (MILLONES DE USD) 50
- TABLA 38 MERCADO DE IMPLANTES COCLEARES EN ALEMANIA POR PRODUCTO, 2022 A 2030 (MILLONES DE USD) 51
- TABLA 39 MERCADO DE IMPLANTES COCLEARES EN ALEMANIA POR TIPO, 2022 A 2030 (MILLONES DE USD) 51
- TABLA 40 MERCADO DE IMPLANTES COCLEARES EN ALEMANIA POR USUARIO FINAL, 2022 A 2030 (MILLONES DE USD) 51
- TABLA 41 MERCADO DE IMPLANTES COCLEARES EN FRANCIA POR PRODUCTO, 2022 A 2030 (MILLONES DE USD) 52
- TABLA 42 MERCADO DE IMPLANTES COCLEARES EN FRANCIA POR TIPO, 2022 A 2030 (MILLONES DE USD) 52
- TABLA 43 MERCADO DE IMPLANTES COCLEARES EN FRANCIA POR USUARIO FINAL, 2022 A 2030 (MILLONES DE USD) 52
- TABLA 44 MERCADO DE IMPLANTES COCLEARES DEL REINO UNIDO POR PRODUCTO, 2022 A 2030 (MILLONES DE USD) 53
- TABLA 45 MERCADO DE IMPLANTES COCLEARES DEL REINO UNIDO POR TIPO, 2022 A 2030 (MILLONES DE USD) 53
- TABLA 46 MERCADO DE IMPLANTES COCLEARES DEL REINO UNIDO POR USUARIO FINAL, 2022 A 2030 (MILLONES DE USD) 53
- TABLA 47 MERCADO DE IMPLANTES COCLEARES DE ITALIA POR PRODUCTO, 2022 A 2030 (MILLONES DE USD) 54
- TABLA 48 MERCADO DE IMPLANTES COCLEARES DE ITALIA POR TIPO, 2022 A 2030 (MILLONES DE USD) 54
- TABLA 49 MERCADO DE IMPLANTES COCLEARES DE ITALIA POR USUARIO FINAL, 2022 A 2030 (MILLONES DE USD) 54
- TABLA 50 MERCADO DE IMPLANTES COCLEARES EN ESPAÑA POR PRODUCTO, 2022 A 2030 (MILLONES DE USD) 55
- TABLA 51 MERCADO DE IMPLANTES COCLEARES EN ESPAÑA POR TIPO, 2022 A 2030 (MILLONES DE USD) 55
- TABLA 52 MERCADO DE IMPLANTES COCLEARES EN ESPAÑA POR USUARIO FINAL, 2022 A 2030 (MILLONES DE USD) 55
- TABLA 53 MERCADO DE IMPLANTES COCLEARES DEL RESTO DE EUROPA OCCIDENTAL POR PRODUCTO, 2022 A 2030 (MILLONES DE USD) 56
- TABLA 54 MERCADO DE IMPLANTES COCLEARES DEL RESTO DE EUROPA OCCIDENTAL POR TIPO, 2022 A 2030 (MILLONES DE USD) 56
- TABLA 55 MERCADO DE IMPLANTES COCLEARES DEL RESTO DE EUROPA OCCIDENTAL POR USUARIO FINAL, 2022 A 2030 (USD MILLONES) 57
- TABLA 56 MERCADO DE IMPLANTES COCLEARES DE EUROPA DEL ESTE POR PRODUCTO, 2022 A 2030 (MILLONES DE USD) 57
- TABLA 57 MERCADO DE IMPLANTES COCLEARES DE EUROPA DEL ESTE POR TIPO, 2022 A 2030 (MILLONES DE USD) 57
- TABLA 58 MERCADO DE IMPLANTES COCLEARES DE EUROPA DEL ESTE POR USUARIO FINAL, 2022 A 2030 (MILLONES DE USD) 58
- TABLA 59 MERCADO DE IMPLANTES COCLEARES DE ASIA Y EL PACÍFICO POR PAÍS, 2022 A 2030 (MILLONES DE USD) 60
- TABLA 60 MERCADO DE IMPLANTES COCLEARES DE ASIA Y EL PACÍFICO POR PRODUCTO, 2022 A 2030 (MILLONES DE USD) 60
- TABLA 61 MERCADO DE IMPLANTES COCLEARES DE ASIA Y EL PACÍFICO POR TIPO, 2022 A 2030 (MILLONES DE USD) 60
- TABLA 62 MERCADO DE IMPLANTES COCLEARES DE ASIA Y EL PACÍFICO POR USUARIO FINAL, 2022 A 2030 (MILLONES DE USD) 61
- TABLA 63 MERCADO DE IMPLANTES COCLEARES DE JAPÓN POR PRODUCTO, 2022 A 2030 (MILLONES DE USD) 61
- TABLA 64 MERCADO DE IMPLANTES COCLEARES EN JAPÓN POR TIPO, 2022 A 2030 (MILLONES DE USD) 61
- TABLA 65 MERCADO DE IMPLANTES COCLEARES EN JAPÓN POR USUARIO FINAL, 2022 A 2030 (MILLONES DE USD) 62
- TABLA 66 MERCADO DE IMPLANTES COCLEARES DE CHINA POR PRODUCTO, 2022 A 2030 (MILLONES DE USD) 62
- TABLA 67 MERCADO DE IMPLANTES COCLEARES DE CHINA POR TIPO, 2022 A 2030 (MILLONES DE USD) 62
- TABLA 68 MERCADO DE IMPLANTES COCLEARES DE CHINA POR USUARIO FINAL, 2022 A 2030 (MILLONES DE USD) 63
- TABLA 69 MERCADO DE IMPLANTES COCLEARES DE INDIA POR PRODUCTO, 2022 A 2030 (MILLONES DE USD) 63
- TABLA 70 MERCADO DE IMPLANTES COCLEARES DE LA INDIA POR TIPO, 2022 A 2030 (MILLONES DE USD) 63
- TABLA 71 MERCADO DE IMPLANTES COCLEARES DE LA INDIA POR USUARIO FINAL, 2022 A 2030 (MILLONES DE USD) 64
- TABLA 72 MERCADO DE IMPLANTES COCLEARES DE AUSTRALIA POR PRODUCTO, 2022 A 2030 (MILLONES DE USD) 64
- TABLA 73 MERCADO DE IMPLANTES COCLEARES DE AUSTRALIA POR TIPO, 2022 A 2030 (MILLONES DE USD) 64
- TABLA 74 MERCADO DE IMPLANTES COCLEARES DE AUSTRALIA POR USUARIO FINAL, 2022 A 2030 (MILLONES DE USD) 65
- TABLA 75 MERCADO DE IMPLANTES COCLEARES DE LA REPÚBLICA DE COREA POR PRODUCTO, 2022 A 2030 (MILLONES DE USD) 65
- TABLA 76 MERCADO DE IMPLANTES COCLEARES EN LA REPÚBLICA DE COREA POR TIPO, 2022 A 2030 (MILLONES DE USD) 65
- TABLA 77 MERCADO DE IMPLANTES COCLEARES EN LA REPÚBLICA DE COREA POR USUARIO FINAL, 2022 A 2030 (MILLONES DE USD) 66
- TABLA 78 MERCADO DEL RESTO DE IMPLANTES COCLEARES DE ASIA Y EL PACÍFICO POR PRODUCTO, 2022 A 2030 (MILLONES DE USD) 66
- TABLA 79 MERCADO DE IMPLANTES COCLEARES DEL RESTO DE ASIA Y EL PACÍFICO POR TIPO, 2022 A 2030 (USD MILLONES) 67
- TABLA 80 RESTO DEL MERCADO DE IMPLANTES COCLEARES DE ASIA Y EL PACÍFICO POR USUARIO FINAL, 2022 A 2030 (MILLONES DE USD) 67
- TABLA 81 ORIENTE MEDIO & MERCADO DE IMPLANTES COCLEARES EN ÁFRICA POR PAÍS, 2022 A 2030 (MILLONES DE USD) 69
- TABLA 82 ORIENTE MEDIO & MERCADO DE IMPLANTES COCLEARES EN ÁFRICA POR PRODUCTO, 2022 A 2030 (MILLONES DE USD) 69
- TABLA 83 ORIENTE MEDIO & MERCADO DE IMPLANTES COCLEARES EN ÁFRICA POR TIPO, 2022 A 2030 (MILLONES DE USD) 70
- TABLA 84 ORIENTE MEDIO & MERCADO DE IMPLANTES COCLEARES EN ÁFRICA POR USUARIO FINAL, 2022 A 2030 (MILLONES DE USD) 70
- TABLA 85 MERCADO DE IMPLANTES COCLEARES EN EMIRATOS ÁRABES UNIDOS POR PRODUCTO, 2022 A 2030 (MILLONES DE USD) 71
- TABLA 86 ÁRABES UNIDOS MERCADO DE IMPLANTES COCLEARES DE EMIRATOS POR TIPO, 2022 A 2030 (MILLONES DE USD) 71
- TABLA 87 MERCADO DE IMPLANTES COCLEARES DE EMIRATOS ÁRABES UNIDOS POR USUARIO FINAL, 2022 A 2030 (MILLONES DE USD) 72
- TABLA 88 SAUDÍ MERCADO DE IMPLANTES COCLEARES DE ARABIA POR PRODUCTO, 2022 A 2030 (MILLONES DE USD) 72
- TABLA 89 MERCADO DE IMPLANTES COCLEARES DE ARABIA SAUDITA POR TIPO, 2022 A 2030 (MILLONES DE USD) 72
- TABLA 90 ARABIA SAUDITA MERCADO DE IMPLANTES COCLEARES POR USUARIO FINAL, 2022 A 2030 (MILLONES DE USD) 73
- TABLA 91 MERCADO DE IMPLANTES COCLEARES DE OMÁN POR PRODUCTO, 2022 A 2030 (MILLONES DE USD) 73
- TABLA 92 MERCADO DE IMPLANTES COCLEARES DE OMÁN POR TIPO, 2022 A 2030 (MILLONES DE USD) 73
- TABLA 93 MERCADO DE IMPLANTES COCLEARES DE OMÁN POR USUARIO FINAL, 2022 A 2030 (MILLONES DE USD) 74
- TABLA 94 MERCADO DE IMPLANTES COCLEARES DE KUWAIT POR PRODUCTO, DE 2022 A 2030 (MILLONES DE USD) 74
- TABLA 95 MERCADO DE IMPLANTES COCLEARES DE KUWAIT POR TIPO, 2022 A 2030 (MILLONES DE USD) 74
- TABLA 96 MERCADO DE IMPLANTES COCLEARES DE KUWAIT POR USUARIO FINAL, 2022 A 2030 (USD MILLONES) 75
- TABLA 97 MERCADO DE IMPLANTES COCLEARES DE QATAR POR PRODUCTO, 2022 A 2030 (MILLONES DE USD) 75
- TABLA 98 MERCADO DE IMPLANTES COCLEARES DE QATAR POR TIPO, 2022 A 2030 (MILLONES DE USD) 75
- TABLA 99 MERCADO DE IMPLANTES COCLEARES DE QATAR POR USUARIO FINAL, 2022 A 2030 (MILLONES DE USD) 76
- TABLA 100 RESTO DE ORIENTE MEDIO & MERCADO DE IMPLANTES COCLEARES EN ÁFRICA POR PRODUCTO, 2022 A 2030 (MILLONES DE USD) 76
- TABLA 101 RESTO DE ORIENTE MEDIO & MERCADO DE IMPLANTES COCLEARES EN ÁFRICA POR TIPO, 2022 A 2030 (MILLONES DE USD) 77
- TABLA 102 RESTO DE ORIENTE MEDIO & MERCADO DE IMPLANTES COCLEARES EN ÁFRICA POR USUARIO FINAL, 2022 A 2030 (MILLONES DE USD) 77
-
14 Lista de cifras
- FIGURA 1 MERCADO MUNDIAL DE IMPLANTES COCLEARES, 2022 A 2030 (MILLONES DE USD) 11
- GRÁFICO 2 CUOTA DE MERCADO GLOBAL DE IMPLANTES COCLEARES POR PRODUCTO, 2022 (%) 12
- GRÁFICO 3 CUOTA DE MERCADO GLOBAL DE IMPLANTES COCLEARES POR TIPO, 2022 (%) 12
- FIGURA 4 CUOTA DE MERCADO GLOBAL COCLEAR PARTICIPACIÓN DE MERCADO DE IMPLANTES POR USUARIO FINAL, 2022 (%) 13
- GRÁFICO 5 PARTICIPACIÓN DE MERCADO MUNDIAL DE IMPLANTES COCLEARES POR REGIÓN, 2022 (%) 13
- GRÁFICO 6 ESTRUCTURA DEL MERCADO MUNDIAL DE IMPLANTES COCLEARES 15
- FIGURA 7 METODOLOGÍA DE INVESTIGACIÓN 16
- FIGURA 8 IMPULSORES Y RESTRAINTS 20
- FIGURA 9 MERCADO MUNDIAL DE IMPLANTES COCLEARES POR PRODUCTO, 2022 Y 2022 2030 (MILLONES DE USD) 27
- FIGURA 10 MERCADO MUNDIAL DE IMPLANTES COCLEARES POR TIPO, 2022 Y 2022 2030 (MILLONES DE USD) 30
- FIGURA 11 MERCADO MUNDIAL DE IMPLANTES COCLEARES POR USUARIO FINAL, 2022 y 2030 2030 (MILLONES DE USD) 33
- FIGURA 12 MERCADO MUNDIAL DE IMPLANTES COCLEARES POR REGIÓN, 2022 Y 2030 2030 (MILLONES DE USD) 37
- GRÁFICO 13 MERCADO DE IMPLANTES COCLEARES EN AMÉRICA POR REGIÓN, 2022 (%) 39
- GRÁFICO 14 MERCADO DE IMPLANTES COCLEARES EN AMÉRICA DEL NORTE POR PAÍS, 2022 (%) 41
- FIGURA 15 MERCADO DE IMPLANTES COCLEARES DE EUROPA POR REGIÓN, 2022 (%) 47
- FIGURA 16 MERCADO DE IMPLANTES COCLEARES DE EUROPA OCCIDENTAL POR PAÍS, 2022 (%) 49
- FIGURA 17 ASIA PACÍFICO MERCADO DE IMPLANTES COCLEARES POR PAÍS, 2022 (%) 59
- GRÁFICO 18 ORIENTE MEDIO & MERCADO DE IMPLANTES COCLEARES DE ÁFRICA POR PAÍS, 2022 (%) 68
- GRÁFICO 19 MERCADO MUNDIAL DE IMPLANTES COCLEARES, ANÁLISIS DE PARTICIPACIÓN DE LAS EMPRESAS, 2022 (%) 78
Customer Stories

“This is really good guys. Excellent work on a tight deadline. I will continue to use you going forward and recommend you to others. Nice job”

“Thanks. It’s been a pleasure working with you, please use me as reference with any other Intel employees.”

“Thanks for sending the report it gives us a good global view of the Betaïne market.”

“Thank you, this will be very helpful for OQS.”

“We found the report very insightful! we found your research firm very helpful. I'm sending this email to secure our future business.”

“I am very pleased with how market segments have been defined in a relevant way for my purposes (such as "Portable Freezers & refrigerators" and "last-mile"). In general the report is well structured. Thanks very much for your efforts.”

“I have been reading the first document or the study, ,the Global HVAC and FP market report 2021 till 2026. Must say, good info! I have not gone in depth at all parts, but got a good indication of the data inside!”

“We got the report in time, we really thank you for your support in this process. I also thank to all of your team as they did a great job.”