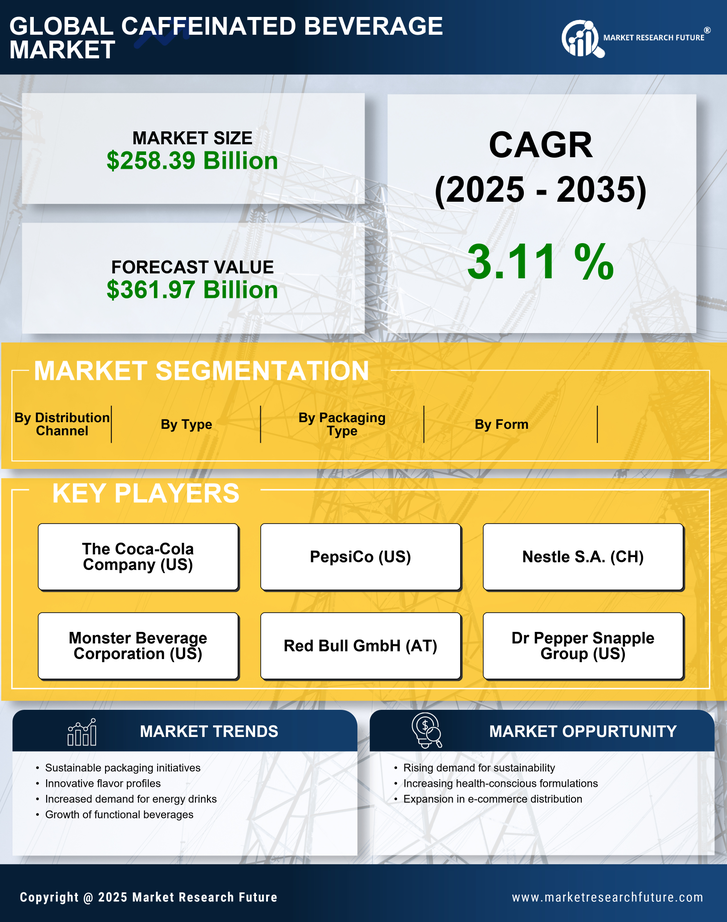
Request Free Sample ×

Kindly complete the form below to receive a free sample of this Report

* Please use a valid business email

Leading companies partner with us for data-driven Insights

clients tt-cursor
Hero Background

Mercado de Bebidas Cafeinadas

ID: MRFR/FnB/36091-HCR
128 Pages
Snehal Singh
Last Updated: April 06, 2026

Informe de Investigación del Mercado de Bebidas Cafeinadas Por Tipo (Café, Té, Bebidas Energéticas, Refrescos, Yerba Mate), Por Forma (Líquido, Polvo, Listo para Beber, Concentrado), Por Tipo de Envase (Latas, Botellas, Tetra Packs, Bolsas), Por Canal de Distribución (Supermercados/Hipermercados, Tiendas de Conveniencia, Venta Online, Tiendas Especializadas) y Por Región (América del Norte, Europa, América del Sur, Asia-Pacífico, Medio Oriente y África) - Pronóstico hasta 2035.

Compartir
Download PDF ×

We do not share your information with anyone. However, we may send you emails based on your report interest from time to time. You may contact us at any time to opt-out.

Caffeinated Beverage Market  Infographic
Purchase Options
  1. 1 SECCIÓN I: RESUMEN EJECUTIVO Y PUNTOS CLAVE\n\n
    1. 1.1 RESUMEN EJECUTIVO\n \n
      1. 1.1.1 VisiĂłn General del Mercado\n \n
      2. 1.1.2 Hallazgos Clave\n \n
      3. 1.1.3 SegmentaciĂłn del Mercado\n \n
      4. 1.1.4 Panorama Competitivo\n \n
      5. 1.1.5 DesafĂ­os y Oportunidades\n \n
      6. 1.1.6 Perspectivas Futuras\n2 SECCIÓN II: ALCANCE, METODOLOGÍA Y ESTRUCTURA DEL MERCADO\n
    2. 2.1 INTRODUCCIÓN AL MERCADO\n \n
      1. 2.1.1 DefiniciĂłn\n \n
      2. 2.1.2 Alcance del estudio\n \n \n
        1. 2.1.2.1 Objetivo de la InvestigaciĂłn\n \n \n
        2. 2.1.2.2 SuposiciĂłn\n \n \n
        3. 2.1.2.3 Limitaciones\n
    3. 2.2 METODOLOGÍA DE INVESTIGACIÓN\n \n
      1. 2.2.1 VisiĂłn General\n \n
      2. 2.2.2 MinerĂ­a de Datos\n \n
      3. 2.2.3 InvestigaciĂłn Secundaria\n \n
      4. 2.2.4 InvestigaciĂłn Primaria\n \n \n
        1. 2.2.4.1 Entrevistas Primarias y Proceso de RecopilaciĂłn de InformaciĂłn\n \n \n
        2. 2.2.4.2 Desglose de los Respondientes Primarios\n \n
      5. 2.2.5 Modelo de PronĂłstico\n \n
      6. 2.2.6 Estimación del Tamaño del Mercado\n \n \n
        1. 2.2.6.1 Enfoque de Arriba hacia Abajo\n \n \n
        2. 2.2.6.2 Enfoque de Abajo hacia Arriba\n \n
      7. 2.2.7 TriangulaciĂłn de Datos\n \n
      8. 2.2.8 Validación\n3 SECCIÓN III: ANÁLISIS CUALITATIVO\n
    4. 3.1 DINÁMICAS DEL MERCADO\n \n
      1. 3.1.1 VisiĂłn General\n \n
      2. 3.1.2 Impulsores\n \n
      3. 3.1.3 Restricciones\n \n
      4. 3.1.4 Oportunidades\n
    5. 3.2 ANÁLISIS DE FACTORES DEL MERCADO\n \n
      1. 3.2.1 AnĂĄlisis de la Cadena de Valor\n \n
      2. 3.2.2 AnĂĄlisis de las Cinco Fuerzas de Porter\n \n \n
        1. 3.2.2.1 Poder de NegociaciĂłn de los Proveedores\n \n \n
        2. 3.2.2.2 Poder de NegociaciĂłn de los Compradores\n \n \n
        3. 3.2.2.3 Amenaza de Nuevos Entrantes\n \n \n
        4. 3.2.2.4 Amenaza de Sustitutos\n \n \n
        5. 3.2.2.5 Intensidad de la Rivalidad\n \n
      3. 3.2.3 AnĂĄlisis del Impacto del COVID-19\n \n \n
        1. 3.2.3.1 AnĂĄlisis del Impacto en el Mercado\n \n \n
        2. 3.2.3.2 Impacto Regional\n \n \n
        3. 3.2.3.3 Análisis de Oportunidades y Amenazas\n4 SECCIÓN IV: ANÁLISIS CUANTITATIVO\n
    6. 4.1 Alimentos, Bebidas y NutriciĂłn, POR Tipo (USD Mil millones)\n \n
      1. 4.1.1 Café\n \n
      2. 4.1.2 TĂ©\n \n
      3. 4.1.3 Bebidas Energéticas\n \n
      4. 4.1.4 Refrescos\n \n
      5. 4.1.5 Yerba Mate\n
    7. 4.2 Alimentos, Bebidas y NutriciĂłn, POR Forma (USD Mil millones)\n \n
      1. 4.2.1 LĂ­quido\n \n
      2. 4.2.2 Polvo\n \n
      3. 4.2.3 Listo para Beber\n \n
      4. 4.2.4 Concentrado\n
    8. 4.3 Alimentos, Bebidas y NutriciĂłn, POR Tipo de Envase (USD Mil millones)\n \n
      1. 4.3.1 Latas\n \n
      2. 4.3.2 Botellas\n \n
      3. 4.3.3 Tetra Packs\n \n
      4. 4.3.4 Bolsas\n
    9. 4.4 Alimentos, Bebidas y NutriciĂłn, POR Canal de DistribuciĂłn (USD Mil millones)\n \n
      1. 4.4.1 Supermercados/Hipermercados\n \n
      2. 4.4.2 Tiendas de Conveniencia\n \n
      3. 4.4.3 Venta Online\n \n
      4. 4.4.4 Tiendas Especializadas\n
    10. 4.5 Alimentos, Bebidas y NutriciĂłn, POR RegiĂłn (USD Mil millones)\n \n
      1. 4.5.1 América del Norte\n \n \n
        1. 4.5.1.1 EE. UU.\n \n \n
        2. 4.5.1.2 CanadĂĄ\n \n
      2. 4.5.2 Europa\n \n \n
        1. 4.5.2.1 Alemania\n \n \n
        2. 4.5.2.2 Reino Unido\n \n \n
        3. 4.5.2.3 Francia\n \n \n
        4. 4.5.2.4 Rusia\n \n \n
        5. 4.5.2.5 Italia\n \n \n
        6. 4.5.2.6 España\n \n \n
        7. 4.5.2.7 Resto de Europa\n \n
      3. 4.5.3 APAC\n \n \n
        1. 4.5.3.1 China\n \n \n
        2. 4.5.3.2 India\n \n \n
        3. 4.5.3.3 JapĂłn\n \n \n
        4. 4.5.3.4 Corea del Sur\n \n \n
        5. 4.5.3.5 Malasia\n \n \n
        6. 4.5.3.6 Tailandia\n \n \n
        7. 4.5.3.7 Indonesia\n \n \n
        8. 4.5.3.8 Resto de APAC\n \n
      4. 4.5.4 América del Sur\n \n \n
        1. 4.5.4.1 Brasil\n \n \n
        2. 4.5.4.2 México\n \n \n
        3. 4.5.4.3 Argentina\n \n \n
        4. 4.5.4.4 Resto de América del Sur\n \n
      5. 4.5.5 MEA\n \n \n
        1. 4.5.5.1 PaĂ­ses del CCG\n \n \n
        2. 4.5.5.2 SudĂĄfrica\n \n \n
        3. 4.5.5.3 Resto de MEA\n5 SECCIÓN V: ANÁLISIS COMPETITIVO\n
    11. 5.1 Panorama Competitivo\n \n
      1. 5.1.1 VisiĂłn General\n \n
      2. 5.1.2 AnĂĄlisis Competitivo\n \n
      3. 5.1.3 AnĂĄlisis de ParticipaciĂłn de Mercado\n \n
      4. 5.1.4 Estrategia de Crecimiento Principal en Alimentos, Bebidas y NutriciĂłn\n \n
      5. 5.1.5 ComparaciĂłn Competitiva\n \n
      6. 5.1.6 Principales Actores en TĂ©rminos de NĂșmero de Desarrollos en Alimentos, Bebidas y NutriciĂłn\n \n
      7. 5.1.7 Principales desarrollos y estrategias de crecimiento\n \n \n
        1. 5.1.7.1 Lanzamiento de Nuevos Productos/ImplementaciĂłn de Servicios\n \n \n
        2. 5.1.7.2 Fusiones y Adquisiciones\n \n \n
        3. 5.1.7.3 Empresas Conjuntas\n \n
      8. 5.1.8 Matriz Financiera de los Principales Actores\n \n \n
        1. 5.1.8.1 Ventas e Ingresos Operativos\n \n \n
        2. 5.1.8.2 Gastos de I+D de los Principales Actores. 2023\n
    12. 5.2 Perfiles de Empresas\n \n
      1. 5.2.1 The Coca-Cola Company (EE. UU.)\n \n \n
        1. 5.2.1.1 VisiĂłn General Financiera\n \n \n
        2. 5.2.1.2 Productos Ofrecidos\n \n \n
        3. 5.2.1.3 Principales Desarrollos\n \n \n
        4. 5.2.1.4 AnĂĄlisis FODA\n \n \n
        5. 5.2.1.5 Estrategias Clave\n \n
      2. 5.2.2 PepsiCo (EE. UU.)\n \n \n
        1. 5.2.2.1 VisiĂłn General Financiera\n \n \n
        2. 5.2.2.2 Productos Ofrecidos\n \n \n
        3. 5.2.2.3 Principales Desarrollos\n \n \n
        4. 5.2.2.4 AnĂĄlisis FODA\n \n \n
        5. 5.2.2.5 Estrategias Clave\n \n
      3. 5.2.3 Nestlé S.A. (CH)\n \n \n
        1. 5.2.3.1 VisiĂłn General Financiera\n \n \n
        2. 5.2.3.2 Productos Ofrecidos\n \n \n
        3. 5.2.3.3 Principales Desarrollos\n \n \n
        4. 5.2.3.4 AnĂĄlisis FODA\n \n \n
        5. 5.2.3.5 Estrategias Clave\n \n
      4. 5.2.4 Monster Beverage Corporation (EE. UU.)\n \n \n
        1. 5.2.4.1 VisiĂłn General Financiera\n \n \n
        2. 5.2.4.2 Productos Ofrecidos\n \n \n
        3. 5.2.4.3 Principales Desarrollos\n \n \n
        4. 5.2.4.4 AnĂĄlisis FODA\n \n \n
        5. 5.2.4.5 Estrategias Clave\n \n
      5. 5.2.5 Red Bull GmbH (AT)\n \n \n
        1. 5.2.5.1 VisiĂłn General Financiera\n \n \n
        2. 5.2.5.2 Productos Ofrecidos\n \n \n
        3. 5.2.5.3 Principales Desarrollos\n \n \n
        4. 5.2.5.4 AnĂĄlisis FODA\n \n \n
        5. 5.2.5.5 Estrategias Clave\n \n
      6. 5.2.6 Dr Pepper Snapple Group (EE. UU.)\n \n \n
        1. 5.2.6.1 VisiĂłn General Financiera\n \n \n
        2. 5.2.6.2 Productos Ofrecidos\n \n \n
        3. 5.2.6.3 Principales Desarrollos\n \n \n
        4. 5.2.6.4 AnĂĄlisis FODA\n \n \n
        5. 5.2.6.5 Estrategias Clave\n \n
      7. 5.2.7 Starbucks Corporation (EE. UU.)\n \n \n
        1. 5.2.7.1 VisiĂłn General Financiera\n \n \n
        2. 5.2.7.2 Productos Ofrecidos\n \n \n
        3. 5.2.7.3 Principales Desarrollos\n \n \n
        4. 5.2.7.4 AnĂĄlisis FODA\n \n \n
        5. 5.2.7.5 Estrategias Clave\n \n
      8. 5.2.8 Keurig Dr Pepper Inc. (EE. UU.)\n \n \n
        1. 5.2.8.1 VisiĂłn General Financiera\n \n \n
        2. 5.2.8.2 Productos Ofrecidos\n \n \n
        3. 5.2.8.3 Principales Desarrollos\n \n \n
        4. 5.2.8.4 AnĂĄlisis FODA\n \n \n
        5. 5.2.8.5 Estrategias Clave\n
    13. 5.3 Apéndice\n \n
      1. 5.3.1 Referencias\n \n
      2. 5.3.2 Informes Relacionados\n6 LISTA DE FIGURAS\n
    14. 6.1 SINOPSIS DEL MERCADO\n
    15. 6.2 ANÁLISIS DEL MERCADO DE AMÉRICA DEL NORTE\n
    16. 6.3 ANÁLISIS DEL MERCADO DE EE. UU. POR TIPO\n
    17. 6.4 ANÁLISIS DEL MERCADO DE EE. UU. POR FORMA\n
    18. 6.5 ANÁLISIS DEL MERCADO DE EE. UU. POR TIPO DE ENVASE\n
    19. 6.6 ANÁLISIS DEL MERCADO DE EE. UU. POR CANAL DE DISTRIBUCIÓN\n
    20. 6.7 ANÁLISIS DEL MERCADO DE CANADÁ POR TIPO\n
    21. 6.8 ANÁLISIS DEL MERCADO DE CANADÁ POR FORMA\n
    22. 6.9 ANÁLISIS DEL MERCADO DE CANADÁ POR TIPO DE ENVASE\n
    23. 6.10 ANÁLISIS DEL MERCADO DE CANADÁ POR CANAL DE DISTRIBUCIÓN\n
    24. 6.11 ANÁLISIS DEL MERCADO DE EUROPA\n
    25. 6.12 ANÁLISIS DEL MERCADO DE ALEMANIA POR TIPO\n
    26. 6.13 ANÁLISIS DEL MERCADO DE ALEMANIA POR FORMA\n
    27. 6.14 ANÁLISIS DEL MERCADO DE ALEMANIA POR TIPO DE ENVASE\n
    28. 6.15 ANÁLISIS DEL MERCADO DE ALEMANIA POR CANAL DE DISTRIBUCIÓN\n
    29. 6.16 ANÁLISIS DEL MERCADO DEL REINO UNIDO POR TIPO\n
    30. 6.17 ANÁLISIS DEL MERCADO DEL REINO UNIDO POR FORMA\n
    31. 6.18 ANÁLISIS DEL MERCADO DEL REINO UNIDO POR TIPO DE ENVASE\n
    32. 6.19 ANÁLISIS DEL MERCADO DEL REINO UNIDO POR CANAL DE DISTRIBUCIÓN\n
    33. 6.20 ANÁLISIS DEL MERCADO DE FRANCIA POR TIPO\n
    34. 6.21 ANÁLISIS DEL MERCADO DE FRANCIA POR FORMA\n
    35. 6.22 ANÁLISIS DEL MERCADO DE FRANCIA POR TIPO DE ENVASE\n
    36. 6.23 ANÁLISIS DEL MERCADO DE FRANCIA POR CANAL DE DISTRIBUCIÓN\n
    37. 6.24 ANÁLISIS DEL MERCADO DE RUSIA POR TIPO\n
    38. 6.25 ANÁLISIS DEL MERCADO DE RUSIA POR FORMA\n
    39. 6.26 ANÁLISIS DEL MERCADO DE RUSIA POR TIPO DE ENVASE\n
    40. 6.27 ANÁLISIS DEL MERCADO DE RUSIA POR CANAL DE DISTRIBUCIÓN\n
    41. 6.28 ANÁLISIS DEL MERCADO DE ITALIA POR TIPO\n
    42. 6.29 ANÁLISIS DEL MERCADO DE ITALIA POR FORMA\n
    43. 6.30 ANÁLISIS DEL MERCADO DE ITALIA POR TIPO DE ENVASE\n
    44. 6.31 ANÁLISIS DEL MERCADO DE ITALIA POR CANAL DE DISTRIBUCIÓN\n
    45. 6.32 ANÁLISIS DEL MERCADO DE ESPAÑA POR TIPO\n
    46. 6.33 ANÁLISIS DEL MERCADO DE ESPAÑA POR FORMA\n
    47. 6.34 ANÁLISIS DEL MERCADO DE ESPAÑA POR TIPO DE ENVASE\n
    48. 6.35 ANÁLISIS DEL MERCADO DE ESPAÑA POR CANAL DE DISTRIBUCIÓN\n
    49. 6.36 ANÁLISIS DEL MERCADO DEL RESTO DE EUROPA POR TIPO\n
    50. 6.37 ANÁLISIS DEL MERCADO DEL RESTO DE EUROPA POR FORMA\n
    51. 6.38 ANÁLISIS DEL MERCADO DEL RESTO DE EUROPA POR TIPO DE ENVASE\n
    52. 6.39 ANÁLISIS DEL MERCADO DEL RESTO DE EUROPA POR CANAL DE DISTRIBUCIÓN\n
    53. 6.40 ANÁLISIS DEL MERCADO DE APAC\n
    54. 6.41 ANÁLISIS DEL MERCADO DE CHINA POR TIPO\n
    55. 6.42 ANÁLISIS DEL MERCADO DE CHINA POR FORMA\n
    56. 6.43 ANÁLISIS DEL MERCADO DE CHINA POR TIPO DE ENVASE\n
    57. 6.44 ANÁLISIS DEL MERCADO DE CHINA POR CANAL DE DISTRIBUCIÓN\n
    58. 6.45 ANÁLISIS DEL MERCADO DE INDIA POR TIPO\n
    59. 6.46 ANÁLISIS DEL MERCADO DE INDIA POR FORMA\n
    60. 6.47 ANÁLISIS DEL MERCADO DE INDIA POR TIPO DE ENVASE\n
    61. 6.48 ANÁLISIS DEL MERCADO DE INDIA POR CANAL DE DISTRIBUCIÓN\n
    62. 6.49 ANÁLISIS DEL MERCADO DE JAPÓN POR TIPO\n
    63. 6.50 ANÁLISIS DEL MERCADO DE JAPÓN POR FORMA\n
    64. 6.51 ANÁLISIS DEL MERCADO DE JAPÓN POR TIPO DE ENVASE\n
    65. 6.52 ANÁLISIS DEL MERCADO DE JAPÓN POR CANAL DE DISTRIBUCIÓN\n
    66. 6.53 ANÁLISIS DEL MERCADO DE COREA DEL SUR POR TIPO\n
    67. 6.54 ANÁLISIS DEL MERCADO DE COREA DEL SUR POR FORMA\n
    68. 6.55 ANÁLISIS DEL MERCADO DE COREA DEL SUR POR TIPO DE ENVASE\n
    69. 6.56 ANÁLISIS DEL MERCADO DE COREA DEL SUR POR CANAL DE DISTRIBUCIÓN\n
    70. 6.57 ANÁLISIS DEL MERCADO DE MALASIA POR TIPO\n
    71. 6.58 ANÁLISIS DEL MERCADO DE MALASIA POR FORMA\n
    72. 6.59 ANÁLISIS DEL MERCADO DE MALASIA POR TIPO DE ENVASE\n
    73. 6.60 ANÁLISIS DEL MERCADO DE MALASIA POR CANAL DE DISTRIBUCIÓN\n
    74. 6.61 ANÁLISIS DEL MERCADO DE TAILANDIA POR TIPO\n
    75. 6.62 ANÁLISIS DEL MERCADO DE TAILANDIA POR FORMA\n
    76. 6.63 ANÁLISIS DEL MERCADO DE TAILANDIA POR TIPO DE ENVASE\n
    77. 6.64 ANÁLISIS DEL MERCADO DE TAILANDIA POR CANAL DE DISTRIBUCIÓN\n
    78. 6.65 ANÁLISIS DEL MERCADO DE INDONESIA POR TIPO\n
    79. 6.66 ANÁLISIS DEL MERCADO DE INDONESIA POR FORMA\n
    80. 6.67 ANÁLISIS DEL MERCADO DE INDONESIA POR TIPO DE ENVASE\n
    81. 6.68 ANÁLISIS DEL MERCADO DE INDONESIA POR CANAL DE DISTRIBUCIÓN\n
    82. 6.69 ANÁLISIS DEL MERCADO DEL RESTO DE APAC POR TIPO\n
    83. 6.70 ANÁLISIS DEL MERCADO DEL RESTO DE APAC POR FORMA\n
    84. 6.71 ANÁLISIS DEL MERCADO DEL RESTO DE APAC POR TIPO DE ENVASE\n
    85. 6.72 ANÁLISIS DEL MERCADO DEL RESTO DE APAC POR CANAL DE DISTRIBUCIÓN\n
    86. 6.73 ANÁLISIS DEL MERCADO DE AMÉRICA DEL SUR\n
    87. 6.74 ANÁLISIS DEL MERCADO DE BRASIL POR TIPO\n
    88. 6.75 ANÁLISIS DEL MERCADO DE BRASIL POR FORMA\n
    89. 6.76 ANÁLISIS DEL MERCADO DE BRASIL POR TIPO DE ENVASE\n
    90. 6.77 ANÁLISIS DEL MERCADO DE BRASIL POR CANAL DE DISTRIBUCIÓN\n
    91. 6.78 ANÁLISIS DEL MERCADO DE MÉXICO POR TIPO\n
    92. 6.79 ANÁLISIS DEL MERCADO DE MÉXICO POR FORMA\n
    93. 6.80 ANÁLISIS DEL MERCADO DE MÉXICO POR TIPO DE ENVASE\n
    94. 6.81 ANÁLISIS DEL MERCADO DE MÉXICO POR CANAL DE DISTRIBUCIÓN\n
    95. 6.82 ANÁLISIS DEL MERCADO DE ARGENTINA POR TIPO\n
    96. 6.83 ANÁLISIS DEL MERCADO DE ARGENTINA POR FORMA\n
    97. 6.84 ANÁLISIS DEL MERCADO DE ARGENTINA POR TIPO DE ENVASE\n
    98. 6.85 ANÁLISIS DEL MERCADO DE ARGENTINA POR CANAL DE DISTRIBUCIÓN\n
    99. 6.86 ANÁLISIS DEL MERCADO DEL RESTO DE AMÉRICA DEL SUR POR TIPO\n
    100. 6.87 ANÁLISIS DEL MERCADO DEL RESTO DE AMÉRICA DEL SUR POR FORMA\n
    101. 6.88 ANÁLISIS DEL MERCADO DEL RESTO DE AMÉRICA DEL SUR POR TIPO DE ENVASE\n
    102. 6.89 ANÁLISIS DEL MERCADO DEL RESTO DE AMÉRICA DEL SUR POR CANAL DE DISTRIBUCIÓN\n
    103. 6.90 ANÁLISIS DEL MERCADO DE MEA\n
    104. 6.91 ANÁLISIS DEL MERCADO DE LOS PAÍSES DEL CCG POR TIPO\n
    105. 6.92 ANÁLISIS DEL MERCADO DE LOS PAÍSES DEL CCG POR FORMA\n
    106. 6.93 ANÁLISIS DEL MERCADO DE LOS PAÍSES DEL CCG POR TIPO DE ENVASE\n
    107. 6.94 ANÁLISIS DEL MERCADO DE LOS PAÍSES DEL CCG POR CANAL DE DISTRIBUCIÓN\n
    108. 6.95 ANÁLISIS DEL MERCADO DE SUDÁFRICA POR TIPO\n
    109. 6.96 ANÁLISIS DEL MERCADO DE SUDÁFRICA POR FORMA\n
    110. 6.97 ANÁLISIS DEL MERCADO DE SUDÁFRICA POR TIPO DE ENVASE\n
    111. 6.98 ANÁLISIS DEL MERCADO DE SUDÁFRICA POR CANAL DE DISTRIBUCIÓN\n
    112. 6.99 ANÁLISIS DEL MERCADO DEL RESTO DE MEA POR TIPO\n
    113. 6.100 ANÁLISIS DEL MERCADO DEL RESTO DE MEA POR FORMA\n
    114. 6.101 ANÁLISIS DEL MERCADO DEL RESTO DE MEA POR TIPO DE ENVASE\n
    115. 6.102 ANÁLISIS DEL MERCADO DEL RESTO DE MEA POR CANAL DE DISTRIBUCIÓN\n
    116. 6.103 CRITERIOS CLAVE DE COMPRA DE ALIMENTOS, BEBIDAS Y NUTRICIÓN\n
    117. 6.104 PROCESO DE INVESTIGACIÓN DE MRFR\n
    118. 6.105 ANÁLISIS DRO DE ALIMENTOS, BEBIDAS Y NUTRICIÓN\n
    119. 6.106 ANÁLISIS DEL IMPACTO DE LOS IMPULSORES: ALIMENTOS, BEBIDAS Y NUTRICIÓN\n
    120. 6.107 ANÁLISIS DEL IMPACTO DE LAS RESTRICCIONES: ALIMENTOS, BEBIDAS Y NUTRICIÓN\n
    121. 6.108 CADENA DE SUMINISTRO / VALOR: ALIMENTOS, BEBIDAS Y NUTRICIÓN\n
    122. 6.109 ALIMENTOS, BEBIDAS Y NUTRICIÓN, POR TIPO, 2024 (% DE PARTICIPACIÓN)\n
    123. 6.110 ALIMENTOS, BEBIDAS Y NUTRICIÓN, POR TIPO, 2024 A 2035 (USD Mil millones)\n
    124. 6.111 ALIMENTOS, BEBIDAS Y NUTRICIÓN, POR FORMA, 2024 (% DE PARTICIPACIÓN)\n
    125. 6.112 ALIMENTOS, BEBIDAS Y NUTRICIÓN, POR FORMA, 2024 A 2035 (USD Mil millones)\n
    126. 6.113 ALIMENTOS, BEBIDAS Y NUTRICIÓN, POR TIPO DE ENVASE, 2024 (% DE PARTICIPACIÓN)\n
    127. 6.114 ALIMENTOS, BEBIDAS Y NUTRICIÓN, POR TIPO DE ENVASE, 2024 A 2035 (USD Mil millones)\n
    128. 6.115 ALIMENTOS, BEBIDAS Y NUTRICIÓN, POR CANAL DE DISTRIBUCIÓN, 2024 (% DE PARTICIPACIÓN)\n
    129. 6.116 ALIMENTOS, BEBIDAS Y NUTRICIÓN, POR CANAL DE DISTRIBUCIÓN, 2024 A 2035 (USD Mil millones)\n
    130. 6.117 COMPARACIÓN DE LOS PRINCIPALES COMPETIDORES\n7 LISTA DE TABLAS\n
    131. 7.1 LISTA DE SUPOSICIONES\n \n
      1. 7.1.1 \n \n
    132. 7.2 ESTIMACIONES DEL TAMAÑO DEL MERCADO DE AMÉRICA DEL NORTE; PRONÓSTICO\n \n
      1. 7.2.1 POR TIPO, 2025-2035 (USD Mil millones)\n \n
      2. 7.2.2 POR FORMA, 2025-2035 (USD Mil millones)\n \n
      3. 7.2.3 POR TIPO DE ENVASE, 2025-2035 (USD Mil millones)\n \n
      4. 7.2.4 POR CANAL DE DISTRIBUCIÓN, 2025-2035 (USD Mil millones)\n
    133. 7.3 ESTIMACIONES DEL TAMAÑO DEL MERCADO DE EE. UU.; PRONÓSTICO\n \n
      1. 7.3.1 POR TIPO, 2025-2035 (USD Mil millones)\n \n
      2. 7.3.2 POR FORMA, 2025-2035 (USD Mil millones)\n \n
      3. 7.3.3 POR TIPO DE ENVASE, 2025-2035 (USD Mil millones)\n \n
      4. 7.3.4 POR CANAL DE DISTRIBUCIÓN, 2025-2035 (USD Mil millones)\n
    134. 7.4 ESTIMACIONES DEL TAMAÑO DEL MERCADO DE CANADÁ; PRONÓSTICO\n \n
      1. 7.4.1 POR TIPO, 2025-2035 (USD Mil millones)\n \n
      2. 7.4.2 POR FORMA, 2025-2035 (USD Mil millones)\n \n
      3. 7.4.3 POR TIPO DE ENVASE, 2025-2035 (USD Mil millones)\n \n
      4. 7.4.4 POR CANAL DE DISTRIBUCIÓN, 2025-2035 (USD Mil millones)\n
    135. 7.5 ESTIMACIONES DEL TAMAÑO DEL MERCADO DE EUROPA; PRONÓSTICO\n \n
      1. 7.5.1 POR TIPO, 2025-2035 (USD Mil millones)\n \n
      2. 7.5.2 POR FORMA, 2025-2035 (USD Mil millones)\n \n
      3. 7.5.3 POR TIPO DE ENVASE, 2025-2035 (USD Mil millones)\n \n
      4. 7.5.4 POR CANAL DE DISTRIBUCIÓN, 2025-2035 (USD Mil millones)\n
    136. 7.6 ESTIMACIONES DEL TAMAÑO DEL MERCADO DE ALEMANIA; PRONÓSTICO\n \n
      1. 7.6.1 POR TIPO, 2025-2035 (USD Mil millones)\n \n
      2. 7.6.2 POR FORMA, 2025-2035 (USD Mil millones)\n \n
      3. 7.6.3 POR TIPO DE ENVASE, 2025-2035 (USD Mil millones)\n \n
      4. 7.6.4 POR CANAL DE DISTRIBUCIÓN, 2025-2035 (USD Mil millones)\n
    137. 7.7 ESTIMACIONES DEL TAMAÑO DEL MERCADO DEL REINO UNIDO; PRONÓSTICO\n \n
      1. 7.7.1 POR TIPO, 2025-2035 (USD Mil millones)\n \n
      2. 7.7.2 POR FORMA, 2025-2035 (USD Mil millones)\n \n
      3. 7.7.3 POR TIPO DE ENVASE, 2025-2035 (USD Mil millones)\n \n
      4. 7.7.4 POR CANAL DE DISTRIBUCIÓN, 2025-2035 (USD Mil millones)\n
    138. 7.8 ESTIMACIONES DEL TAMAÑO DEL MERCADO DE FRANCIA; PRONÓSTICO\n \n
      1. 7.8.1 POR TIPO, 2025-2035 (USD Mil millones)\n \n
      2. 7.8.2 POR FORMA, 2025-2035 (USD Mil millones)\n \n
      3. 7.8.3 POR TIPO DE ENVASE, 2025-2035 (USD Mil millones)\n \n
      4. 7.8.4 POR CANAL DE DISTRIBUCIÓN, 2025-2035 (USD Mil millones)\n
    139. 7.9 ESTIMACIONES DEL TAMAÑO DEL MERCADO DE RUSIA; PRONÓSTICO\n \n
      1. 7.9.1 POR TIPO, 2025-2035 (USD Mil millones)\n \n
      2. 7.9.2 POR FORMA, 2025-2035 (USD Mil millones)\n \n
      3. 7.9.3 POR TIPO DE ENVASE, 2025-2035 (USD Mil millones)\n \n
      4. 7.9.4 POR CANAL DE DISTRIBUCIÓN, 2025-2035 (USD Mil millones)\n
    140. 7.10 ESTIMACIONES DEL TAMAÑO DEL MERCADO DE ITALIA; PRONÓSTICO\n \n
      1. 7.10.1 POR TIPO, 2025-2035 (USD Mil millones)\n \n
      2. 7.10.2 POR FORMA, 2025-2035 (USD Mil millones)\n \n
      3. 7.10.3 POR TIPO DE ENVASE, 2025-2035 (USD Mil millones)\n \n
      4. 7.10.4 POR CANAL DE DISTRIBUCIÓN, 2025-2035 (USD Mil millones)\n
    141. 7.11 ESTIMACIONES DEL TAMAÑO DEL MERCADO DE ESPAÑA; PRONÓSTICO\n \n
      1. 7.11.1 POR TIPO, 2025-2035 (USD Mil millones)\n \n
      2. 7.11.2 POR FORMA, 2025-2035 (USD Mil millones)\n \n
      3. 7.11.3 POR TIPO DE ENVASE, 2025-2035 (USD Mil millones)\n \n
      4. 7.11.4 POR CANAL DE DISTRIBUCIÓN, 2025-2035 (USD Mil millones)\n
    142. 7.12 ESTIMACIONES DEL TAMAÑO DEL MERCADO DEL RESTO DE EUROPA; PRONÓSTICO\n \n
      1. 7.12.1 POR TIPO, 2025-2035 (USD Mil millones)\n \n
      2. 7.12.2 POR FORMA, 2025-2035 (USD Mil millones)\n \n
      3. 7.12.3 POR TIPO DE ENVASE, 2025-2035 (USD Mil millones)\n \n
      4. 7.12.4 POR CANAL DE DISTRIBUCIÓN, 2025-2035 (USD Mil millones)\n
    143. 7.13 ESTIMACIONES DEL TAMAÑO DEL MERCADO DE APAC; PRONÓSTICO\n \n
      1. 7.13.1 POR TIPO, 2025-2035 (USD Mil millones)\n \n
      2. 7.13.2 POR FORMA, 2025-2035 (USD Mil millones)\n \n
      3. 7.13.3 POR TIPO DE ENVASE, 2025-2035 (USD Mil millones)\n \n
      4. 7.13.4 POR CANAL DE DISTRIBUCIÓN, 2025-2035 (USD Mil millones)\n
    144. 7.14 ESTIMACIONES DEL TAMAÑO DEL MERCADO DE CHINA; PRONÓSTICO\n \n
      1. 7.14.1 POR TIPO, 2025-2035 (USD Mil millones)\n \n
      2. 7.14.2 POR FORMA, 2025-2035 (USD Mil millones)\n \n
      3. 7.14.3 POR TIPO DE ENVASE, 2025-2035 (USD Mil millones)\n \n
      4. 7.14.4 POR CANAL DE DISTRIBUCIÓN, 2025-2035 (USD Mil millones)\n
    145. 7.15 ESTIMACIONES DEL TAMAÑO DEL MERCADO DE INDIA; PRONÓSTICO\n \n
      1. 7.15.1 POR TIPO, 2025-2035 (USD Mil millones)\n \n
      2. 7.15.2 POR FORMA, 2025-2035 (USD Mil millones)\n \n
      3. 7.15.3 POR TIPO DE ENVASE, 2025-2035 (USD Mil millones)\n \n
      4. 7.15.4 POR CANAL DE DISTRIBUCIÓN, 2025-2035 (USD Mil millones)\n
    146. 7.16 ESTIMACIONES DEL TAMAÑO DEL MERCADO DE JAPÓN; PRONÓSTICO\n \n
      1. 7.16.1 POR TIPO, 2025-2035 (USD Mil millones)\n \n
      2. 7.16.2 POR FORMA, 2025-2035 (USD Mil millones)\n \n
      3. 7.16.3 POR TIPO DE ENVASE, 2025-2035 (USD Mil millones)\n \n
      4. 7.16.4 POR CANAL DE DISTRIBUCIÓN, 2025-2035 (USD Mil millones)\n
    147. 7.17 ESTIMACIONES DEL TAMAÑO DEL MERCADO DE COREA DEL SUR; PRONÓSTICO\n \n
      1. 7.17.1 POR TIPO, 2025-2035 (USD Mil millones)\n \n
      2. 7.17.2 POR FORMA, 2025-2035 (USD Mil millones)\n \n
      3. 7.17.3 POR TIPO DE ENVASE, 2025-2035 (USD Mil millones)\n \n
      4. 7.17.4 POR CANAL DE DISTRIBUCIÓN, 2025-2035 (USD Mil millones)\n
    148. 7.18 ESTIMACIONES DEL TAMAÑO DEL MERCADO DE MALASIA; PRONÓSTICO\n \n
      1. 7.18.1 POR TIPO, 2025-2035 (USD Mil millones)\n \n
      2. 7.18.2 POR FORMA, 2025-2035 (USD Mil millones)\n \n
      3. 7.18.3 POR TIPO DE ENVASE, 2025-2035 (USD Mil millones)\n \n
      4. 7.18.4 POR CANAL DE DISTRIBUCIÓN, 2025-2035 (USD Mil millones)\n
    149. 7.19 ESTIMACIONES DEL TAMAÑO DEL MERCADO DE TAILANDIA; PRONÓSTICO\n \n
      1. 7.19.1 POR TIPO, 2025-2035 (USD Mil millones)\n \n
      2. 7.19.2 POR FORMA, 2025-2035 (USD Mil millones)\n \n
      3. 7.19.3 POR TIPO DE ENVASE, 2025-2035 (USD Mil millones)\n \n
      4. 7.19.4 POR CANAL DE DISTRIBUCIÓN, 2025-2035 (USD Mil millones)\n
    150. 7.20 ESTIMACIONES DEL TAMAÑO DEL MERCADO DE INDONESIA; PRONÓSTICO\n \n
      1. 7.20.1 POR TIPO, 2025-2035 (USD Mil millones)\n \n
      2. 7.20.2 POR FORMA, 2025-2035 (USD Mil millones)\n \n
      3. 7.20.3 POR TIPO DE ENVASE, 2025-2035 (USD Mil millones)\n \n
      4. 7.20.4 POR CANAL DE DISTRIBUCIÓN, 2025-2035 (USD Mil millones)\n
    151. 7.21 ESTIMACIONES DEL TAMAÑO DEL MERCADO DEL RESTO DE APAC; PRONÓSTICO\n \n
      1. 7.21.1 POR TIPO, 2025-2035 (USD Mil millones)\n \n
      2. 7.21.2 POR FORMA, 2025-2035 (USD Mil millones)\n \n
      3. 7.21.3 POR TIPO DE ENVASE, 2025-2035 (USD Mil millones)\n \n
      4. 7.21.4 POR CANAL DE DISTRIBUCIÓN, 2025-2035 (USD Mil millones)\n
    152. 7.22 ESTIMACIONES DEL TAMAÑO DEL MERCADO DE AMÉRICA DEL SUR; PRONÓSTICO\n \n
      1. 7.22.1 POR TIPO, 2025-2035 (USD Mil millones)\n \n
      2. 7.22.2 POR FORMA, 2025-2035 (USD Mil millones)\n \n
      3. 7.22.3 POR TIPO DE ENVASE, 2025-2035 (USD Mil millones)\n \n
      4. 7.22.4 POR CANAL DE DISTRIBUCIÓN, 2025-2035 (USD Mil millones)\n
    153. 7.23 ESTIMACIONES DEL TAMAÑO DEL MERCADO DE BRASIL; PRONÓSTICO\n \n
      1. 7.23.1 POR TIPO, 2025-2035 (USD Mil millones)\n \n
      2. 7.23.2 POR FORMA, 2025-2035 (USD Mil millones)\n \n
      3. 7.23.3 POR TIPO DE ENVASE, 2025-2035 (USD Mil millones)\n \n
      4. 7.23.4 POR CANAL DE DISTRIBUCIÓN, 2025-2035 (USD Mil millones)\n
    154. 7.24 ESTIMACIONES DEL TAMAÑO DEL MERCADO DE MÉXICO; PRONÓSTICO\n \n
      1. 7.24.1 POR TIPO, 2025-2035 (USD Mil millones)\n \n
      2. 7.24.2 POR FORMA, 2025-2035 (USD Mil millones)\n \n
      3. 7.24.3 POR TIPO DE ENVASE, 2025-2035 (USD Mil millones)\n \n
      4. 7.24.4 POR CANAL DE DISTRIBUCIÓN, 2025-2035 (USD Mil millones)\n
    155. 7.25 ESTIMACIONES DEL TAMAÑO DEL MERCADO DE ARGENTINA; PRONÓSTICO\n \n
      1. 7.25.1 POR TIPO, 2025-2035 (USD Mil millones)\n \n
      2. 7.25.2 POR FORMA, 2025-2035 (USD Mil millones)\n \n
      3. 7.25.3 POR TIPO DE ENVASE, 2025-2035 (USD Mil millones)\n \n
      4. 7.25.4 POR CANAL DE DISTRIBUCIÓN, 2025-2035 (USD Mil millones)\n
    156. 7.26 ESTIMACIONES DEL TAMAÑO DEL MERCADO DEL RESTO DE AMÉRICA DEL SUR; PRONÓSTICO\n \n
      1. 7.26.1 POR TIPO, 2025-2035 (USD Mil millones)\n \n
      2. 7.26.2 POR FORMA, 2025-2035 (USD Mil millones)\n \n
      3. 7.26.3 POR TIPO DE ENVASE, 2025-2035 (USD Mil millones)\n \n
      4. 7.26.4 POR CANAL DE DISTRIBUCIÓN, 2025-2035 (USD Mil millones)\n
    157. 7.27 ESTIMACIONES DEL TAMAÑO DEL MERCADO DE MEA; PRONÓSTICO\n \n
      1. 7.27.1 POR TIPO, 2025-2035 (USD Mil millones)\n \n
      2. 7.27.2 POR FORMA, 2025-2035 (USD Mil millones)\n \n
      3. 7.27.3 POR TIPO DE ENVASE, 2025-2035 (USD Mil millones)\n \n
      4. 7.27.4 POR CANAL DE DISTRIBUCIÓN, 2025-2035 (USD Mil millones)\n
    158. 7.28 ESTIMACIONES DEL TAMAÑO DEL MERCADO DE LOS PAÍSES DEL CCG; PRONÓSTICO\n \n
      1. 7.28.1 POR TIPO, 2025-2035 (USD Mil millones)\n \n
      2. 7.28.2 POR FORMA, 2025-2035 (USD Mil millones)\n \n
      3. 7.28.3 POR TIPO DE ENVASE, 2025-2035 (USD Mil millones)\n \n
      4. 7.28.4 POR CANAL DE DISTRIBUCIÓN, 2025-2035 (USD Mil millones)\n
    159. 7.29 ESTIMACIONES DEL TAMAÑO DEL MERCADO DE SUDÁFRICA; PRONÓSTICO\n \n
      1. 7.29.1 POR TIPO, 2025-2035 (USD Mil millones)\n \n
      2. 7.29.2 POR FORMA, 2025-2035 (USD Mil millones)\n \n
      3. 7.29.3 POR TIPO DE ENVASE, 2025-2035 (USD Mil millones)\n \n
      4. 7.29.4 POR CANAL DE DISTRIBUCIÓN, 2025-2035 (USD Mil millones)\n
    160. 7.30 ESTIMACIONES DEL TAMAÑO DEL MERCADO DEL RESTO DE MEA; PRONÓSTICO\n \n
      1. 7.30.1 POR TIPO, 2025-2035 (USD Mil millones)\n \n
      2. 7.30.2 POR FORMA, 2025-2035 (USD Mil millones)\n \n
      3. 7.30.3 POR TIPO DE ENVASE, 2025-2035 (USD Mil millones)\n \n
      4. 7.30.4 POR CANAL DE DISTRIBUCIÓN, 2025-2035 (USD Mil millones)\n
    161. 7.31 LANZAMIENTO DE PRODUCTO/DESARROLLO/APROBACIÓN\n \n
      1. 7.31.1 \n \n
    162. 7.32 ADQUISICIÓN/PARTNERSHIP\n \n

SegmentaciĂłn del Mercado de Bebidas Cafeinadas

  • Mercado de Bebidas Cafeinadas por Tipo (USD Mil millones, 2019-2032)
    • CafĂ©
    • TĂ©
    • Bebidas EnergĂ©ticas
    • Bebidas Gaseosas
    • Yerba Mate

  • Mercado de Bebidas Cafeinadas por Forma (USD Mil millones, 2019-2032)
    • Liquido
    • Polvo
    • Listo para Beber
    • Concentrado

  • Mercado de Bebidas Cafeinadas por Tipo de Envase (USD Mil millones, 2019-2032)
    • Latas
    • Botellas
    • Packs Tetra
    • Bolsas

  • Mercado de Bebidas Cafeinadas por Canal de DistribuciĂłn (USD Mil millones, 2019-2032)
    • Supermercados/Hipermercados
    • Tiendas de Conveniencia
    • Venta en LĂ­nea
    • Tiendas Especializadas

  • Mercado de Bebidas Cafeinadas por RegiĂłn (USD Mil millones, 2019-2032)
    • AmĂ©rica del Norte
    • Europa
    • AmĂ©rica del Sur
    • Asia-PacĂ­fico
    • Medio Oriente y África

Perspectiva Regional del Mercado de Bebidas Cafeinadas (USD Mil millones, 2019-2032)

  • Perspectiva de AmĂ©rica del Norte (USD Mil millones, 2019-2032)
    • Mercado de Bebidas Cafeinadas de AmĂ©rica del Norte por Tipo
      • CafĂ©
      • TĂ©
      • Bebidas EnergĂ©ticas
      • Bebidas Gaseosas
      • Yerba Mate
    • Mercado de Bebidas Cafeinadas de AmĂ©rica del Norte por Tipo de Forma
      • Liquido
      • Polvo
      • Listo para Beber
      • Concentrado
    • Mercado de Bebidas Cafeinadas de AmĂ©rica del Norte por Tipo de Envase
      • Latas
      • Botellas
      • Packs Tetra
      • Bolsas
    • Mercado de Bebidas Cafeinadas de AmĂ©rica del Norte por Tipo de Canal de DistribuciĂłn
      • Supermercados/Hipermercados
      • Tiendas de Conveniencia
      • Venta en LĂ­nea
      • Tiendas Especializadas
    • Mercado de Bebidas Cafeinadas de AmĂ©rica del Norte por Tipo Regional
      • EE. UU.
      • CanadĂĄ
    • Perspectiva de EE. UU. (USD Mil millones, 2019-2032)
    • Mercado de Bebidas Cafeinadas de EE. UU. por Tipo
      • CafĂ©
      • TĂ©
      • Bebidas EnergĂ©ticas
      • Bebidas Gaseosas
      • Yerba Mate
    • Mercado de Bebidas Cafeinadas de EE. UU. por Tipo de Forma
      • Liquido
      • Polvo
      • Listo para Beber
      • Concentrado
    • Mercado de Bebidas Cafeinadas de EE. UU. por Tipo de Envase
      • Latas
      • Botellas
      • Packs Tetra
      • Bolsas
    • Mercado de Bebidas Cafeinadas de EE. UU. por Tipo de Canal de DistribuciĂłn
      • Supermercados/Hipermercados
      • Tiendas de Conveniencia
      • Venta en LĂ­nea
      • Tiendas Especializadas
    • Perspectiva de CANADÁ (USD Mil millones, 2019-2032)
    • Mercado de Bebidas Cafeinadas de CANADÁ por Tipo
      • CafĂ©
      • TĂ©
      • Bebidas EnergĂ©ticas
      • Bebidas Gaseosas
      • Yerba Mate
    • Mercado de Bebidas Cafeinadas de CANADÁ por Tipo de Forma
      • Liquido
      • Polvo
      • Listo para Beber
      • Concentrado
    • Mercado de Bebidas Cafeinadas de CANADÁ por Tipo de Envase
      • Latas
      • Botellas
      • Packs Tetra
      • Bolsas
    • Mercado de Bebidas Cafeinadas de CANADÁ por Tipo de Canal de DistribuciĂłn
      • Supermercados/Hipermercados
      • Tiendas de Conveniencia
      • Venta en LĂ­nea
      • Tiendas Especializadas
    • Perspectiva de Europa (USD Mil millones, 2019-2032)
      • Mercado de Bebidas Cafeinadas de Europa por Tipo
        • CafĂ©
        • TĂ©
        • Bebidas EnergĂ©ticas
        • Bebidas Gaseosas
        • Yerba Mate
      • Mercado de Bebidas Cafeinadas de Europa por Tipo de Forma
        • Liquido
        • Polvo
        • Listo para Beber
        • Concentrado
      • Mercado de Bebidas Cafeinadas de Europa por Tipo de Envase
        • Latas
        • Botellas
        • Packs Tetra
        • Bolsas
      • Mercado de Bebidas Cafeinadas de Europa por Tipo de Canal de DistribuciĂłn
        • Supermercados/Hipermercados
        • Tiendas de Conveniencia
        • Venta en LĂ­nea
        • Tiendas Especializadas
      • Mercado de Bebidas Cafeinadas de Europa por Tipo Regional
        • Alemania
        • Reino Unido
        • Francia
        • Rusia
        • Italia
        • España
        • Resto de Europa
      • Perspectiva de ALEMANIA (USD Mil millones, 2019-2032)
      • Mercado de Bebidas Cafeinadas de ALEMANIA por Tipo
        • CafĂ©
        • TĂ©
        • Bebidas EnergĂ©ticas
        • Bebidas Gaseosas
        • Yerba Mate
      • Mercado de Bebidas Cafeinadas de ALEMANIA por Tipo de Forma
        • Liquido
        • Polvo
        • Listo para Beber
        • Concentrado
      • Mercado de Bebidas Cafeinadas de ALEMANIA por Tipo de Envase
        • Latas
        • Botellas
        • Packs Tetra
        • Bolsas
      • Mercado de Bebidas Cafeinadas de ALEMANIA por Tipo de Canal de DistribuciĂłn
        • Supermercados/Hipermercados
        • Tiendas de Conveniencia
        • Venta en LĂ­nea
        • Tiendas Especializadas
      • Perspectiva de REINO UNIDO (USD Mil millones, 2019-2032)
      • Mercado de Bebidas Cafeinadas de REINO UNIDO por Tipo
        • CafĂ©
        • TĂ©
        • Bebidas EnergĂ©ticas
        • Bebidas Gaseosas
        • Yerba Mate
      • Mercado de Bebidas Cafeinadas de REINO UNIDO por Tipo de Forma
        • Liquido
        • Polvo
        • Listo para Beber
        • Concentrado
      • Mercado de Bebidas Cafeinadas de REINO UNIDO por Tipo de Envase
        • Latas
        • Botellas
        • Packs Tetra
        • Bolsas
      • Mercado de Bebidas Cafeinadas de REINO UNIDO por Tipo de Canal de DistribuciĂłn
        • Supermercados/Hipermercados
        • Tiendas de Conveniencia
        • Venta en LĂ­nea
        • Tiendas Especializadas
      • Perspectiva de FRANCIA (USD Mil millones, 2019-2032)
      • Mercado de Bebidas Cafeinadas de FRANCIA por Tipo
        • CafĂ©
        • TĂ©
        • Bebidas EnergĂ©ticas
        • Bebidas Gaseosas
        • Yerba Mate
      • Mercado de Bebidas Cafeinadas de FRANCIA por Tipo de Forma
        • Liquido
        • Polvo
        • Listo para Beber
        • Concentrado
      • Mercado de Bebidas Cafeinadas de FRANCIA por Tipo de Envase
        • Latas
        • Botellas
        • Packs Tetra
        • Bolsas
      • Mercado de Bebidas Cafeinadas de FRANCIA por Tipo de Canal de DistribuciĂłn
        • Supermercados/Hipermercados
        • Tiendas de Conveniencia
        • Venta en LĂ­nea
        • Tiendas Especializadas
      • Perspectiva de RUSIA (USD Mil millones, 2019-2032)
      • Mercado de Bebidas Cafeinadas de RUSIA por Tipo
        • CafĂ©
        • TĂ©
        • Bebidas EnergĂ©ticas
        • Bebidas Gaseosas
        • Yerba Mate
      • Mercado de Bebidas Cafeinadas de RUSIA por Tipo de Forma
        • Liquido
        • Polvo
        • Listo para Beber
        • Concentrado
      • Mercado de Bebidas Cafeinadas de RUSIA por Tipo de Envase
        • Latas
        • Botellas
        • Packs Tetra
        • Bolsas
      • Mercado de Bebidas Cafeinadas de RUSIA por Tipo de Canal de DistribuciĂłn
        • Supermercados/Hipermercados
        • Tiendas de Conveniencia
        • Venta en LĂ­nea
        • Tiendas Especializadas
      • Perspectiva de ITALIA (USD Mil millones, 2019-2032)
      • Mercado de Bebidas Cafeinadas de ITALIA por Tipo
        • CafĂ©
        • TĂ©
        • Bebidas EnergĂ©ticas
        • Bebidas Gaseosas
        • Yerba Mate
      • Mercado de Bebidas Cafeinadas de ITALIA por Tipo de Forma
        • Liquido
        • Polvo
        • Listo para Beber
        • Concentrado
      • Mercado de Bebidas Cafeinadas de ITALIA por Tipo de Envase
        • Latas
        • Botellas
        • Packs Tetra
        • Bolsas
      • Mercado de Bebidas Cafeinadas de ITALIA por Tipo de Canal de DistribuciĂłn
        • Supermercados/Hipermercados
        • Tiendas de Conveniencia
        • Venta en LĂ­nea
        • Tiendas Especializadas
      • Perspectiva de ESPAÑA (USD Mil millones, 2019-2032)
      • Mercado de Bebidas Cafeinadas de ESPAÑA por Tipo
        • CafĂ©
        • TĂ©
        • Bebidas EnergĂ©ticas
        • Bebidas Gaseosas
        • Yerba Mate
      • Mercado de Bebidas Cafeinadas de ESPAÑA por Tipo de Forma
        • Liquido
        • Polvo
        • Listo para Beber
        • Concentrado
      • Mercado de Bebidas Cafeinadas de ESPAÑA por Tipo de Envase
        • Latas
        • Botellas
        • Packs Tetra
        • Bolsas
      • Mercado de Bebidas Cafeinadas de ESPAÑA por Tipo de Canal de DistribuciĂłn
        • Supermercados/Hipermercados
        • Tiendas de Conveniencia
        • Venta en LĂ­nea
        • Tiendas Especializadas
      • Perspectiva de RESTO DE EUROPA (USD Mil millones, 2019-2032)
      • Mercado de Bebidas Cafeinadas de RESTO DE EUROPA por Tipo
        • CafĂ©
        • TĂ©
        • Bebidas EnergĂ©ticas
        • Bebidas Gaseosas
        • Yerba Mate
      • Mercado de Bebidas Cafeinadas de RESTO DE EUROPA por Tipo de Forma
        • Liquido
        • Polvo
        • Listo para Beber
        • Concentrado
      • Mercado de Bebidas Cafeinadas de RESTO DE EUROPA por Tipo de Envase
        • Latas
        • Botellas
        • Packs Tetra
        • Bolsas
      • Mercado de Bebidas Cafeinadas de RESTO DE EUROPA por Tipo de Canal de DistribuciĂłn
        • Supermercados/Hipermercados
        • Tiendas de Conveniencia
        • Venta en LĂ­nea
        • Tiendas Especializadas
      • Perspectiva de APAC (USD Mil millones, 2019-2032)
        • Mercado de Bebidas Cafeinadas de APAC por Tipo
          • CafĂ©
          • TĂ©
          • Bebidas EnergĂ©ticas
          • Bebidas Gaseosas
          • Yerba Mate
        • Mercado de Bebidas Cafeinadas de APAC por Tipo de Forma
          • Liquido
          • Polvo
          • Listo para Beber
          • Concentrado
        • Mercado de Bebidas Cafeinadas de APAC por Tipo de Envase
          • Latas
          • Botellas
          • Packs Tetra
          • Bolsas
        • Mercado de Bebidas Cafeinadas de APAC por Tipo de Canal de DistribuciĂłn
          • Supermercados/Hipermercados
          • Tiendas de Conveniencia
          • Venta en LĂ­nea
          • Tiendas Especializadas
        • Mercado de Bebidas Cafeinadas de APAC por Tipo Regional
          • China
          • India
          • JapĂłn
          • Corea del Sur
          • Malasia
          • Tailandia
          • Indonesia
          • Resto de APAC
        • Perspectiva de CHINA (USD Mil millones, 2019-2032)
        • Mercado de Bebidas Cafeinadas de CHINA por Tipo
          • CafĂ©
          • TĂ©
          • Bebidas EnergĂ©ticas
          • Bebidas Gaseosas
          • Yerba Mate
        • Mercado de Bebidas Cafeinadas de CHINA por Tipo de Forma
          • Liquido
          • Polvo
          • Listo para Beber
          • Concentrado
        • Mercado de Bebidas Cafeinadas de CHINA por Tipo de Envase
          • Latas
          • Botellas
          • Packs Tetra
          • Bolsas
        • Mercado de Bebidas Cafeinadas de CHINA por Tipo de Canal de DistribuciĂłn
          • Supermercados/Hipermercados
          • Tiendas de Conveniencia
          • Venta en LĂ­nea
          • Tiendas Especializadas
        • Perspectiva de INDIA (USD Mil millones, 2019-2032)
        • Mercado de Bebidas Cafeinadas de INDIA por Tipo
          • CafĂ©
          • TĂ©
          • Bebidas EnergĂ©ticas
          • Bebidas Gaseosas
          • Yerba Mate
        • Mercado de Bebidas Cafeinadas de INDIA por Tipo de Forma
          • Liquido
          • Polvo
          • Listo para Beber
          • Concentrado
        • Mercado de Bebidas Cafeinadas de INDIA por Tipo de Envase
          • Latas
          • Botellas
          • Packs Tetra
          • Bolsas
        • Mercado de Bebidas Cafeinadas de INDIA por Tipo de Canal de DistribuciĂłn
          • Supermercados/Hipermercados
          • Tiendas de Conveniencia
          • Venta en LĂ­nea
          • Tiendas Especializadas
        • Perspectiva de JAPÓN (USD Mil millones, 2019-2032)
        • Mercado de Bebidas Cafeinadas de JAPÓN por Tipo
          • CafĂ©
          • TĂ©
          • Bebidas EnergĂ©ticas
          • Bebidas Gaseosas
          • Yerba Mate
        • Mercado de Bebidas Cafeinadas de JAPÓN por Tipo de Forma
          • Liquido
          • Polvo
          • Listo para Beber
          • Concentrado
        • Mercado de Bebidas Cafeinadas de JAPÓN por Tipo de Envase
          • Latas
          • Botellas
          • Packs Tetra
          • Bolsas
        • Mercado de Bebidas Cafeinadas de JAPÓN por Tipo de Canal de DistribuciĂłn
          • Supermercados/Hipermercados
          • Tiendas de Conveniencia
          • Venta en LĂ­nea
          • Tiendas Especializadas
        • Perspectiva de COREA DEL SUR (USD Mil millones, 2019-2032)
        • Mercado de Bebidas Cafeinadas de COREA DEL SUR por Tipo
          • CafĂ©
          • TĂ©
          • Bebidas EnergĂ©ticas
          • Bebidas Gaseosas
          • Yerba Mate
        • Mercado de Bebidas Cafeinadas de COREA DEL SUR por Tipo de Forma
          • Liquido
          • Polvo
          • Listo para Beber
          • Concentrado
        • Mercado de Bebidas Cafeinadas de COREA DEL SUR por Tipo de Envase
          • Latas
          • Botellas
          • Packs Tetra
          • Bolsas
        • Mercado de Bebidas Cafeinadas de COREA DEL SUR por Tipo de Canal de DistribuciĂłn
          • Supermercados/Hipermercados
          • Tiendas de Conveniencia
          • Venta en LĂ­nea
          • Tiendas Especializadas
        • Perspectiva de MALASIA (USD Mil millones, 2019-2032)
        • Mercado de Bebidas Cafeinadas de MALASIA por Tipo
          • CafĂ©
          • TĂ©
          • Bebidas EnergĂ©ticas
          • Bebidas Gaseosas
          • Yerba Mate
        • Mercado de Bebidas Cafeinadas de MALASIA por Tipo de Forma
          • Liquido
          • Polvo
          • Listo para Beber
          • Concentrado
        • Mercado de Bebidas Cafeinadas de MALASIA por Tipo de Envase
          • Latas
          • Botellas
          • Packs Tetra
          • Bolsas
        • Mercado de Bebidas Cafeinadas de MALASIA por Tipo de Canal de DistribuciĂłn
          • Supermercados/Hipermercados
          • Tiendas de Conveniencia
          • Venta en LĂ­nea
          • Tiendas Especializadas
        • Perspectiva de TAILANDIA (USD Mil millones, 2019-2032)
        • Mercado de Bebidas Cafeinadas de TAILANDIA por Tipo
          • CafĂ©
          • TĂ©
          • Bebidas EnergĂ©ticas
          • Bebidas Gaseosas
          • Yerba Mate
        • Mercado de Bebidas Cafeinadas de TAILANDIA por Tipo de Forma
          • Liquido
          • Polvo
          • Listo para Beber
          • Concentrado
        • Mercado de Bebidas Cafeinadas de TAILANDIA por Tipo de Envase
          • Latas
          • Botellas
          • Packs Tetra
          • Bolsas
        • Mercado de Bebidas Cafeinadas de TAILANDIA por Tipo de Canal de DistribuciĂłn
          • Supermercados/Hipermercados
          • Tiendas de Conveniencia
          • Venta en LĂ­nea
          • Tiendas Especializadas
        • Perspectiva de INDONESIA (USD Mil millones, 2019-2032)
        • Mercado de Bebidas Cafeinadas de INDONESIA por Tipo
          • CafĂ©
          • TĂ©
          • Bebidas EnergĂ©ticas
          • Bebidas Gaseosas
          • Yerba Mate
        • Mercado de Bebidas Cafeinadas de INDONESIA por Tipo de Forma
          • Liquido
          • Polvo
          • Listo para Beber
          • Concentrado
        • Mercado de Bebidas Cafeinadas de INDONESIA por Tipo de Envase
          • Latas
          • Botellas
          • Packs Tetra
          • Bolsas
        • Mercado de Bebidas Cafeinadas de INDONESIA por Tipo de Canal de DistribuciĂłn
          • Supermercados/Hipermercados
          • Tiendas de Conveniencia
          • Venta en LĂ­nea
          • Tiendas Especializadas
        • Perspectiva de RESTO DE APAC (USD Mil millones, 2019-2032)
        • Mercado de Bebidas Cafeinadas de RESTO DE APAC por Tipo
          • CafĂ©
          • TĂ©
          • Bebidas EnergĂ©ticas
          • Bebidas Gaseosas
          • Yerba Mate
        • Mercado de Bebidas Cafeinadas de RESTO DE APAC por Tipo de Forma
          • Liquido
          • Polvo
          • Listo para Beber
          • Concentrado
        • Mercado de Bebidas Cafeinadas de RESTO DE APAC por Tipo de Envase
          • Latas
          • Botellas
          • Packs Tetra
          • Bolsas
        • Mercado de Bebidas Cafeinadas de RESTO DE APAC por Tipo de Canal de DistribuciĂłn
          • Supermercados/Hipermercados
          • Tiendas de Conveniencia
          • Venta en LĂ­nea
          • Tiendas Especializadas
        • Perspectiva de AmĂ©rica del Sur (USD Mil millones, 2019-2032)
          • Mercado de Bebidas Cafeinadas de AmĂ©rica del Sur por Tipo
            • CafĂ©
            • TĂ©
            • Bebidas EnergĂ©ticas
            • Bebidas Gaseosas
            • Yerba Mate
          • Mercado de Bebidas Cafeinadas de AmĂ©rica del Sur por Tipo de Forma
            • Liquido
            • Polvo
            • Listo para Beber
            • Concentrado
          • Mercado de Bebidas Cafeinadas de AmĂ©rica del Sur por Tipo de Envase
            • Latas
            • Botellas
            • Packs Tetra
            • Bolsas
          • Mercado de Bebidas Cafeinadas de AmĂ©rica del Sur por Tipo de Canal de DistribuciĂłn
            • Supermercados/Hipermercados
            • Tiendas de Conveniencia
            • Venta en LĂ­nea
            • Tiendas Especializadas
          • Mercado de Bebidas Cafeinadas de AmĂ©rica del Sur por Tipo Regional
            • Brasil
            • MĂ©xico
            • Argentina
            • Resto de AmĂ©rica del Sur
          • Perspectiva de BRASIL (USD Mil millones, 2019-2032)
          • Mercado de Bebidas Cafeinadas de BRASIL por Tipo
            • CafĂ©
            • TĂ©
            • Bebidas EnergĂ©ticas
            • Bebidas Gaseosas
            • Yerba Mate
          • Mercado de Bebidas Cafeinadas de BRASIL por Tipo de Forma
            • Liquido
            • Polvo
            • Listo para Beber
            • Concentrado
          • Mercado de Bebidas Cafeinadas de BRASIL por Tipo de Envase
            • Latas
            • Botellas
            • Packs Tetra
            • Bolsas
          • Mercado de Bebidas Cafeinadas de BRASIL por Tipo de Canal de DistribuciĂłn
            • Supermercados/Hipermercados
            • Tiendas de Conveniencia
            • Venta en LĂ­nea
            • Tiendas Especializadas
          • Perspectiva de MÉXICO (USD Mil millones, 2019-2032)
          • Mercado de Bebidas Cafeinadas de MÉXICO por Tipo
            • CafĂ©
            • TĂ©
            • Bebidas EnergĂ©ticas
            • Bebidas Gaseosas
            • Yerba Mate
          • Mercado de Bebidas Cafeinadas de MÉXICO por Tipo de Forma
            • Liquido
            • Polvo
            • Listo para Beber
            • Concentrado
          • Mercado de Bebidas Cafeinadas de MÉXICO por Tipo de Envase
            • Latas
            • Botellas
            • Packs Tetra
            • Bolsas
          • Mercado de Bebidas Cafeinadas de MÉXICO por Tipo de Canal de DistribuciĂłn
            • Supermercados/Hipermercados
            • Tiendas de Conveniencia
            • Venta en LĂ­nea
            • Tiendas Especializadas
          • Perspectiva de ARGENTINA (USD Mil millones, 2019-2032)
          • Mercado de Bebidas Cafeinadas de ARGENTINA por Tipo
            • CafĂ©
            • TĂ©
            • Bebidas EnergĂ©ticas
            • Bebidas Gaseosas
            • Yerba Mate
          • Mercado de Bebidas Cafeinadas de ARGENTINA por Tipo de Forma
            • Liquido
            • Polvo
            • Listo para Beber
            • Concentrado
          • Mercado de Bebidas Cafeinadas de ARGENTINA por Tipo de Envase
            • Latas
            • Botellas
            • Packs Tetra
            • Bolsas
          • Mercado de Bebidas Cafeinadas de ARGENTINA por Tipo de Canal de DistribuciĂłn
            • Supermercados/Hipermercados
            • Tiendas de Conveniencia
            • Venta en LĂ­nea
            • Tiendas Especializadas
          • Perspectiva de RESTO DE AMÉRICA DEL SUR (USD Mil millones, 2019-2032)
          • Mercado de Bebidas Cafeinadas de RESTO DE AMÉRICA DEL SUR por Tipo
            • CafĂ©
            • TĂ©
            • Bebidas EnergĂ©ticas
            • Bebidas Gaseosas
            • Yerba Mate
          • Mercado de Bebidas Cafeinadas de RESTO DE AMÉRICA DEL SUR por Tipo de Forma
            • Liquido
            • Polvo
            • Listo para Beber
            • Concentrado
          • Mercado de Bebidas Cafeinadas de RESTO DE AMÉRICA DEL SUR por Tipo de Envase
            • Latas
            • Botellas
            • Packs Tetra
            • Bolsas
          • Mercado de Bebidas Cafeinadas de RESTO DE AMÉRICA DEL SUR por Tipo de Canal de DistribuciĂłn
            • Supermercados/Hipermercados
            • Tiendas de Conveniencia
            • Venta en LĂ­nea
            • Tiendas Especializadas
          • Perspectiva de MEA (USD Mil millones, 2019-2032)
            • Mercado de Bebidas Cafeinadas de MEA por Tipo
              • CafĂ©
              • TĂ©
              • Bebidas EnergĂ©ticas
              • Bebidas Gaseosas
              • Yerba Mate
            • Mercado de Bebidas Cafeinadas de MEA por Tipo de Forma
              • Liquido
              • Polvo
              • Listo para Beber
              • Concentrado
            • Mercado de Bebidas Cafeinadas de MEA por Tipo de Envase
              • Latas
              • Botellas
              • Packs Tetra
              • Bolsas
            • Mercado de Bebidas Cafeinadas de MEA por Tipo de Canal de DistribuciĂłn
              • Supermercados/Hipermercados
              • Tiendas de Conveniencia
              • Venta en LĂ­nea
              • Tiendas Especializadas
            • Mercado de Bebidas Cafeinadas de MEA por Tipo Regional
              • PaĂ­ses del CCG
              • SudĂĄfrica
              • Resto de MEA
            • Perspectiva de PAÍSES DEL CCG (USD Mil millones, 2019-2032)
            • Mercado de Bebidas Cafeinadas de PAÍSES DEL CCG por Tipo
              • CafĂ©
              • TĂ©
              • Bebidas EnergĂ©ticas
              • Bebidas Gaseosas
              • Yerba Mate
            • Mercado de Bebidas Cafeinadas de PAÍSES DEL CCG por Tipo de Forma
              • Liquido
              • Polvo
              • Listo para Beber
              • Concentrado
            • Mercado de Bebidas Cafeinadas de PAÍSES DEL CCG por Tipo de Envase
              • Latas
              • Botellas
              • Packs Tetra
              • Bolsas
            • Mercado de Bebidas Cafeinadas de PAÍSES DEL CCG por Tipo de Canal de DistribuciĂłn
              • Supermercados/Hipermercados
              • Tiendas de Conveniencia
              • Venta en LĂ­nea
              • Tiendas Especializadas
            • Perspectiva de SUDÁFRICA (USD Mil millones, 2019-2032)
            • Mercado de Bebidas Cafeinadas de SUDÁFRICA por Tipo
              • CafĂ©
              • TĂ©
              • Bebidas EnergĂ©ticas
              • Bebidas Gaseosas
              • Yerba Mate
            • Mercado de Bebidas Cafeinadas de SUDÁFRICA por Tipo de Forma
              • Liquido
              • Polvo
              • Listo para Beber
              • Concentrado
            • Mercado de Bebidas Cafeinadas de SUDÁFRICA por Tipo de Envase
              • Latas
              • Botellas
              • Packs Tetra
              • Bolsas
            • Mercado de Bebidas Cafeinadas de SUDÁFRICA por Tipo de Canal de DistribuciĂłn
              • Supermercados/Hipermercados
              • Tiendas de Conveniencia
              • Venta en LĂ­nea
              • Tiendas Especializadas
            • Perspectiva de RESTO DE MEA (USD Mil millones, 2019-2032)
            • Mercado de Bebidas Cafeinadas de RESTO DE MEA por Tipo
              • CafĂ©
              • TĂ©
              • Bebidas EnergĂ©ticas
              • Bebidas Gaseosas
              • Yerba Mate
            • Mercado de Bebidas Cafeinadas de RESTO DE MEA por Tipo de Forma
              • Liquido
              • Polvo
              • Listo para Beber
              • Concentrado
            • Mercado de Bebidas Cafeinadas de RESTO DE MEA por Tipo de Envase
              • Latas
              • Botellas
              • Packs Tetra
              • Bolsas
            • Mercado de Bebidas Cafeinadas de RESTO DE MEA por Tipo de Canal de DistribuciĂłn
              • Supermercados/Hipermercados
              • Tiendas de Conveniencia
              • Venta en LĂ­nea
              • Tiendas Especializadas

Compare Licence

×
Features License Type
Single User Multiuser License Enterprise User
Price $4,950 $5,950 $7,250
Maximum User Access Limit 1 User Upto 10 Users Unrestricted Access Throughout the Organization
Free Customization ✓ ✓ ✓
Direct Access to Analyst ✓ ✓ ✓
Deliverable Format ✓ ✓ ✓
Platform Access ✗ ✗ ✓
Discount on Next Purchase 10% 15% 15%
Printable Versions ✗ ✗ ✓