• Cat-intel
  • MedIntelliX
  • Resources
  • About Us
  • Hero Background
    English
    Chinese
    French
    Japanese
    Korean
    German
    Spanish

    Treated Distillate Aromatic Extracts (TDAE) Market Trends

    ID: MRFR/CnM/3530-CR
    137 Pages
    Anshula Mandaokar
    February 2021

    Treated Distillate Aromatic Extracts Market Application (tires & tubes, belting & houses, battery containers, extruded products, & others) and Region (Asia Pacific, Europe, North America, Latin America, Middle east & Africa) - Forecast till 2035

    Share:
    Download PDF ×

    We do not share your information with anyone. However, we may send you emails based on your report interest from time to time. You may contact us at any time to opt-out.

    Treated Distillate Aromatic Extracts (TDAE) Market Infographic
    $ 4,950.0
    $ 5,950.0
    $ 7,250.0

    Market Trends

    Key Emerging Trends in the Treated Distillate Aromatic Extracts (TDAE) Market

    The Treated Distillate Aromatic Extracts (TDAE) market is influenced by several key market trends that shape its dynamics and growth trajectory. Shift Towards Environmentally Friendly Rubber Processing Oils: There is a growing trend towards environmentally friendly rubber processing oils, driven by increasing regulatory scrutiny and consumer demand for sustainable products. TDAE, being derived from low aromatic content base oils, is gaining popularity as a greener alternative to traditional aromatic extract oils. Manufacturers are focusing on developing TDAE formulations that offer high performance while meeting stringent environmental regulations, leading to increased adoption of TDAE in the rubber industry. Rising Demand for Tire Manufacturing: The tire manufacturing industry represents a significant market for TDAE, as it is used as a processing aid and extender oil in tire compounding. With the growing automotive sector worldwide and increasing demand for tires, especially in emerging economies, the demand for TDAE in tire manufacturing is on the rise. TDAE offers advantages such as improved processability, reduced rolling resistance, and enhanced tire performance, driving its demand in the tire industry. Focus on Enhanced Performance and Product Quality: Manufacturers of TDAE are increasingly focusing on enhancing product performance and quality to meet the evolving requirements of end-users in various industries. Advanced refining processes and formulation techniques are being employed to produce TDAE oils with superior properties such as low volatility, high viscosity index, and excellent compatibility with rubber compounds. The emphasis on product innovation and quality enhancement is driving market differentiation and competitiveness in the TDAE market. Growing Demand for High-Quality Rubber Compounds: The demand for high-quality rubber compounds is rising across industries such as automotive, construction, and industrial manufacturing, driving the demand for TDAE as a key ingredient in rubber formulations. TDAE offers benefits such as improved processing characteristics, better dispersion of fillers and additives, and enhanced mechanical properties in rubber compounds. Manufacturers are catering to the demand for high-performance rubber compounds by offering specialized TDAE formulations tailored to specific application requirements. Expansion of Rubber Recycling and Reclaiming Industry: The rubber recycling and reclaiming industry is witnessing significant growth, driven by increasing environmental concerns, sustainability initiatives, and regulations related to waste management. TDAE is used as a processing aid in the production of reclaimed rubber from waste tires and rubber scraps. With the growing emphasis on circular economy principles and resource conservation, the demand for TDAE in the rubber recycling and reclaiming industry is expected to increase. Emergence of Bio-based TDAE Alternatives: With the growing focus on sustainability and renewable resources, there is a rising interest in developing bio-based alternatives to conventional TDAE oils derived from petroleum feedstocks. Manufacturers are exploring bio-based oils and renewable feedstocks as substitutes for TDAE in rubber compounding applications. Bio-based TDAE alternatives offer the potential to reduce carbon footprint, mitigate environmental impact, and meet the sustainability goals of end-users in the rubber industry. Technological Advancements in TDAE Production: Technological advancements in TDAE production processes are driving efficiency improvements, cost optimization, and quality enhancement in the TDAE market. Advanced refining techniques, process automation, and quality control measures are being implemented to ensure consistent product quality and performance. Additionally, investments in research and development are leading to the development of innovative TDAE formulations with enhanced properties and functionality, catering to diverse application requirements. Market Consolidation and Strategic Partnerships: The TDAE market is witnessing consolidation through mergers, acquisitions, and strategic partnerships among key players in the industry. Companies are collaborating to expand their product portfolios, geographical presence, and market reach in the global TDAE market. Strategic alliances and partnerships enable companies to leverage synergies, share resources, and enhance their competitiveness in the market, driving market consolidation and growth. Impact of COVID-19 Pandemic: The COVID-19 pandemic has had a significant impact on the TDAE market, disrupting supply chains, reducing demand from end-user industries, and causing fluctuations in raw material prices. However, as economies recover and industries resume operations, the demand for TDAE is expected to rebound, driven by the revival of automotive production, infrastructure projects, and construction activities worldwide. Companies are adapting to the changing market dynamics and implementing strategies to mitigate the impact of the pandemic on the TDAE market. Market Expansion in Emerging Economies: Emerging economies in Asia Pacific, Latin America, and Africa present lucrative opportunities for market expansion in the TDAE industry. Rapid industrialization, urbanization, and infrastructure development in these regions are driving the demand for rubber products and TDAE oils. Manufacturers are expanding their presence in emerging markets through investments, partnerships, and distribution networks to capitalize on growth opportunities and establish a strong foothold in dynamic regions.

    Market Summary

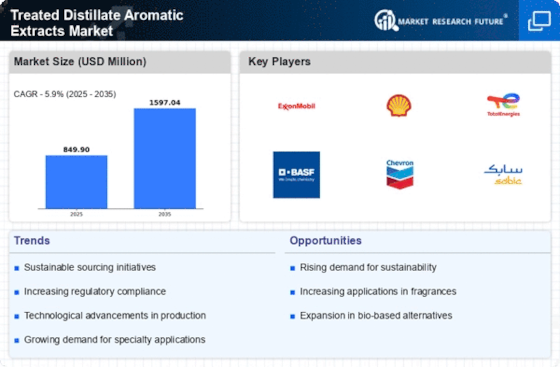
    As per Market Research Future Analysis, the Treated Distillate Aromatic Extracts (TDAE) market was valued at USD 849.90 Million in 2024 and is projected to reach USD 1597.04 Million by 2035, growing at a CAGR of 5.90% from 2025 to 2035. The market is driven by the increasing demand for rubber softening additives in the automotive industry, particularly in tire manufacturing. However, environmental regulations concerning the toxic content of TDAE pose significant challenges. The COVID-19 pandemic negatively impacted production and sales, leading to a reevaluation of strategies within the industry. Major players are focusing on R&D to address regulatory changes and improve product standards.

    Key Market Trends & Highlights

    The TDAE market is witnessing significant growth driven by various factors.

    • Market Size in 2024: USD 849.90 Million
    • Projected Market Size by 2035: USD 1597.04 Million
    • CAGR from 2025 to 2035: 5.90%
    • Tires and tubes segment accounts for around 70% of the overall market size.

    Market Size & Forecast

    2024 Market Size USD 849.90 Million
    2035 Market Size USD 1597.04 Million
    CAGR (2024-2035) 5.90%
    Largest Regional Market Share Asia Pacific

    Major Players

    Royal Dutch Shell Plc, Total SA, H&R Group, ATDM, CPC Corporation, Lanxess, Nynas, Eagal Petrochem

    Market Trends

    The increasing demand for environmentally friendly products is likely to drive innovation in the Treated Distillate Aromatic Extracts Market, as manufacturers seek to align with sustainability goals and regulatory standards.

    U.S. Environmental Protection Agency

    Treated Distillate Aromatic Extracts (TDAE) Market Market Drivers

    Market Growth Projections

    The Global Treated Distillate Aromatic Extracts Market Industry is projected to experience substantial growth in the coming years. With a market value of 849.9 USD Million in 2024, it is anticipated to reach 1613.5 USD Million by 2035. This growth trajectory reflects a compound annual growth rate (CAGR) of 6.0% from 2025 to 2035. Such projections indicate a robust demand for treated distillate aromatic extracts, driven by various factors including technological advancements, regulatory support, and changing consumer preferences. The market's expansion is likely to create new opportunities for manufacturers and stakeholders, fostering innovation and competition within the industry.

    Expansion of the Aromatics Market

    The expansion of the global aromatics market is a crucial driver for the Global Treated Distillate Aromatic Extracts Market Industry. As the demand for fragrances and flavoring agents increases across various sectors, including food and beverages, cosmetics, and household products, treated distillate aromatic extracts are becoming essential components. This growth is supported by the rising disposable incomes and changing lifestyles, particularly in emerging economies. The market's trajectory suggests a continuous upward trend, with forecasts indicating a substantial increase in market value, thereby reinforcing the importance of treated distillate aromatic extracts in meeting the evolving needs of consumers.

    Growing Demand in End-Use Industries

    The Global Treated Distillate Aromatic Extracts Market Industry experiences robust growth due to increasing demand from various end-use sectors, including automotive, construction, and consumer goods. These extracts are utilized for their aromatic properties and as solvents, enhancing product performance. For instance, the automotive sector employs these extracts in coatings and adhesives, which are essential for vehicle manufacturing. As industries expand, the market is projected to reach 849.9 USD Million in 2024, reflecting a significant uptick in consumption. This trend indicates a shift towards high-performance materials, thereby driving the demand for treated distillate aromatic extracts.

    Regulatory Support for Sustainable Practices

    Regulatory frameworks promoting sustainability are influencing the Global Treated Distillate Aromatic Extracts Market Industry. Governments worldwide are implementing stringent regulations to reduce environmental impact, encouraging manufacturers to adopt eco-friendly practices. This shift is evident in the adoption of treated distillate aromatic extracts, which are often derived from renewable sources. For example, the European Union's Green Deal aims to make Europe climate-neutral by 2050, fostering innovation in sustainable materials. Consequently, the market is expected to grow, with projections indicating a rise to 1613.5 USD Million by 2035, as companies align with these regulations and consumer preferences for sustainable products.

    Rising Consumer Preference for Natural Products

    The Global Treated Distillate Aromatic Extracts Market Industry is witnessing a shift in consumer preferences towards natural and organic products. This trend is driven by heightened awareness of health and environmental issues, prompting consumers to seek products with fewer synthetic chemicals. Treated distillate aromatic extracts, often derived from natural sources, align with this demand, making them increasingly popular in personal care, food, and beverage applications. As manufacturers respond to this trend by incorporating these extracts into their formulations, the market is expected to expand significantly, reflecting a broader movement towards sustainability and health-conscious choices.

    Technological Advancements in Extraction Processes

    Technological innovations in extraction processes are significantly enhancing the efficiency and quality of treated distillate aromatic extracts. The Global Treated Distillate Aromatic Extracts Market Industry benefits from advancements such as solvent extraction and distillation techniques, which improve yield and reduce production costs. For instance, the introduction of supercritical fluid extraction has revolutionized the industry, allowing for the extraction of high-purity aromatic compounds. These advancements not only optimize resource utilization but also cater to the increasing demand for high-quality extracts. As a result, the market is poised for growth, with a projected CAGR of 6.0% from 2025 to 2035, indicating a strong future outlook.

    Market Segment Insights

    Regional Insights

    Key Companies in the Treated Distillate Aromatic Extracts (TDAE) Market market include

    Industry Developments

      • October 2020: Sulzer supplied a customized mass transfer solution to PT Enerco RPO Internasional's grassroots facility in Batam, Indonesia, which produces treated distillate aromatic extract (TDAE). Sulzer created and built the world's largest agitated extraction column, the KuhniTM (ECR). This piece of equipment is critical in the production of environmentally friendly rubber process oils (RPOs) for the tire and rubber industries. This column, which measures 2.8 m (9 ft 2 in.) in diameter and 34 m (111 ft 6 in.) in height, is the largest of its kind and enables PT Enerco RPO International to distribute significant volumes of TDAE.
      • China has become one of the major countries generating revenue in the TDAE market for the Asia-Pacific region. The revenue of USD 133.1 million in 2016 shows its rising growth.
      • Europe has come under the influence of many regulatory precedents in recent times. Therefore, the strict regulations have resulted in major strategic reforms by key players in the existing market.
      • The global TDAE market would most probably reach around USD 1027.1 million by 2027 at an expected CAGR of 3.71%.
      • The tires and tubes segment accounted for around 70% of the overall TDAE market size.
      • Asia Pacific region is the dominant market leader emerging in recent times with around 45% of the global share.

    Future Outlook

    Treated Distillate Aromatic Extracts (TDAE) Market Future Outlook

    The Treated Distillate Aromatic Extracts Market is projected to grow at a 5.90% CAGR from 2025 to 2035, driven by increasing demand in various industrial applications and sustainable sourcing initiatives.

    New opportunities lie in:

    • Develop eco-friendly extraction technologies to enhance product appeal.
    • Expand into emerging markets with tailored marketing strategies.
    • Invest in R&D for innovative applications in cosmetics and pharmaceuticals.

    By 2035, the market is expected to achieve robust growth, reflecting evolving consumer preferences and technological advancements.

    Market Segmentation

    Report Overview

    • Recent developments in the market
    • Analysis of regional market for TDAE
    • Overview of market segmentation
    • Analysis of the competitive landscape
    • Value chain analysis for TDAE market research
    • Explaining market dynamics of the TDAE market
    • Analysis of the TDAE market in response to COVID 19
    • Market overview and highlights of the global TDAE market

    Segment Overview

    • By Application
    • By Region

    Recent Developments

    • Asia Pacific region is the dominant market leader emerging in recent times with around 45% of the global share.
    • The tires and tubes segment accounted for around 70% of the overall TDAE market size.
    • The global TDAE market would most probably reach around USD 1027.1 million by 2027 at an expected CAGR of 3.71%.
    • Europe has come under the influence of many regulatory precedents in recent times. Therefore, the strict regulations have resulted in major strategic reforms by key players in the existing market.
    • China has become one of the major countries generating revenue in the TDAE market for the Asia-Pacific region. The revenue of USD 133.1 million in 2016 shows its rising growth.
    • October 2020: Sulzer supplied a customized mass transfer solution to PT Enerco RPO Internasional's grassroots facility in Batam, Indonesia, which produces treated distillate aromatic extract (TDAE). Sulzer created and built the world's largest agitated extraction column, the KuhniTM (ECR). This piece of equipment is critical in the production of environmentally friendly rubber process oils (RPOs) for the tire and rubber industries. This column, which measures 2.8 m (9 ft 2 in.) in diameter and 34 m (111 ft 6 in.) in height, is the largest of its kind and enables PT Enerco RPO International to distribute significant volumes of TDAE.

    Competitive Landscape of TDAE Market

    • Eagal Petrochrm
    • Lanxess, Nynas
    • CPC Corporation
    • ATDM
    • Total SA, H&R Group
    • Royal Dutch Shell Plc

    Report Scope

    Attribute/Metric Details
    Market Size 2024 USD 849.90 Million
    Market Size 2035 1597.04 (Value (USD Million))
    Compound Annual Growth Rate (CAGR) 5.90% (2025 - 2035)
    Base Year 2024
    Market Forecast Period 2025 - 2035
    Historical Data 2018 & 2020
    Market Forecast Units Value (USD Million)
    Report Coverage Revenue Forecast, Market Competitive Landscape, Growth Factors, and Trends
    Segments Covered Factors and application
    Geographies Covered North America, Europe, Asia Pacific, and the Rest of the World
    Countries Covered The U.S, Canada, Germany, France, the UK, Italy, Spain, China, Japan, India, Australia, South Korea, and Brazil
    Key Companies Profiled Royal Dutch Shell Plc, Total SA, H&R Group, ATDM, CPC Corporation, Lanxess, Nynas, Eagal Petrochrm
    Key Market Opportunities Market demand for TDAE
    Key Market Dynamics Growth of the transportation industry and maritime trade
    Market Size 2025 900.06 (Value (USD Million))

    Market Highlights

    Author

    Anshula Mandaokar
    Team Lead - Research

    She holds an experience of about 6+ years in market research and business consulting, working under the spectrum of information communication technology, telecommunications and semiconductor domains. aarti conceptualizes and implements a scalable business strategy and provides strategic leadership to the clients. her expertise lies in market estimation, competitive intelligence, pipeline analysis, customer assessment, etc.

    Leave a Comment

    Latest Comments

    John Doe
    john@example.com

    This is a great article! Really helped me understand the topic better.

    Posted on July 23, 2025, 10:15 AM
    Jane Smith
    jane@domain.com

    Thanks for sharing this. I’ve bookmarked it for later reference.

    Posted on July 22, 2025, 7:45 PM

    FAQs

    Who are the key players in TDAE market?

    The key players in the treated distillate aromatic extracts market include H&R group, Eagel Petrochem, Royal Dutch Shell Plc, CPC Corporation, Nynas, ATDM and Total SA and others.

    Which region would grab the maximum market share in TDAE?

    The Asia Pacific region can gain a major share of the market in the forecast period.

    What is the growth prediction for the TDAE market?

    The TDAE market would grow profoundly at a rate of 5.90% CAGR in the period between 2024 and 2032.

    What are the factors driving the growth of TDAE market?

    The increasing growth of the transportation industry is the foremost factor for driving the growth of TDAE market.

    What will be the value of TDAE market?

    The global TDAE market is expected to reach around USD 1358.56 million by 2032.

    1. Report Prologue
    2. Market Definition
      1. Definition 13
      2. Scope of the Study 13
        1. Research Objectives 13
        2. Assumptions 14
        3. Limitations 14
      3. Market Structure 14
    3. Research Methodology
      1. Research Process 15
      2. Primary Research 16
      3. Secondary Research 16
      4. Market Size Estimation 16
    4. Market Dynamics
      1. Introduction 19
      2. Drivers 20
        1. Dynamic Growth In Transportation Industry 20
        2. Widening Scope Of Rubber Goods 21
        3. Growing Consumption Of Rubber Processing Oil 22
      3. Restraints 23
        1. Stringent Environmental Regulation Linked With Regional Ban On Consumption Of TDAE 23
      4. Opportunities 24
        1. Increasing Global Industrials Output 24
      5. Market Trends 24
        1. Increasing Focus/ Investment On Research & Development Activities 24
    5. Market Factor Analysis
      1. Supply Chain Analysis 25
        1. Raw Material Producers 25
        2. TDAE Manufacturers 25
        3. Distributors 25
        4. End Users 26
      2. Porter 5 Forces Analysis 26
        1. Competitive Rivalry 27
        2. Threat Of New Entrants 27
        3. Threat Of New Substitute 27
        4. Bargaining Power Of Suppliers 27
        5. Bargaining Of Consumers 27
    6. Global Treated Distillate Aromatic Extracts Market, By Application
      1. Introduction 28
      2. Tires & Tubes 30
      3. Belting & Houses 31
      4. Battery Containers 32
      5. Extruded Products 33
      6. Others 34
    7. Global Treated Distillate Aromatic Extracts Market, By Region
    8. Global Treated Distillate Aromatic Extracts Market, By Region 36
      1. Introduction 36
      2. North America 38
        1. The U.S. 39
        2. Canada 40
      3. Europe 42
        1. Germany 44
        2. France 45
        3. UK 46
        4. Italy 47
        5. Spain 48
        6. Rest Of The Europe 49
      4. Asia Pacific 50
        1. China 52
        2. India 53
        3. Japan 54
        4. South Korea 55
        5. Rest Of The Asia Pacific 56
      5. Latin America 57
        1. Brazil 59
        2. Mexico 60
        3. Rest Of The Latin America 61
      6. Middle East & Africa 62
        1. Saudi Arabia 64
        2. UAE 65
        3. Rest Of The Middle East & Africa 66
    9. Competitive Landscape
      1. Introduction 67
      2. Key Developments
    10. Company Profiles
      1. Lanxess 68
        1. Company Overview 68
        2. Financials 68
        3. Products 68
        4. Strategy 68
        5. Key Developments 68
      2. Royal Dutch Shell Plc 69
        1. Company Overview 69
        2. Financials 69
        3. Products 69
        4. Strategy 69
        5. Key Developments 69
      3. CPC Corporation 70
        1. Company Overview 70
        2. Financials 70
        3. Products 70
        4. Strategy 70
        5. Key Developments 70
      4. Total S.A 71
        1. Company Overview 71
        2. Financials 71
        3. Products 71
        4. Key Developments 71
      5. Eni.S.P.A 72
        1. Company Overview 72
        2. Financials 72
        3. Products 72
        4. Strategy 72
        5. Key Developments 72
      6. Gazpromneft - Lubricants, Ltd. 73
        1. Company Overview 73
        2. Financials 73
        3. Products 73
        4. Strategy 73
        5. Key Developments 73
      7. H&R GROUP 74
        1. Company Overview 74
        2. Financials 74
        3. Products 74
        4. Strategy 74
        5. Key Developments 74
      8. Nynas 75
        1. Company Overview 75
        2. Financials 75
        3. Products 75
        4. Strategy 75
        5. Key Developments 75
      9. Eagal Petrochem 76
        1. Company Overview 76
        2. Financials 76
        3. Products 76
        4. Strategy 76
        5. Key Developments 76
      10. ATDM 77
        1. Company Overview 77
        2. Financials 77
        3. Products 77
        4. Key Developments 77
    11. Conclusion
    12. List of Tables and Figures
      1. 10 List Of Tables
      2. TABLE 1 GLOBAL TREATED DISTILLATE AROMATIC EXTRACTS MARKET, BY APPLICATION 2020-2027 (USD MILLION) 28
      3. TABLE 2 GLOBAL TREATED DISTILLATE AROMATIC EXTRACTS MARKET, BY APPLICATION 2020-2027 (KT) 29
      4. TABLE 3 GLOBAL TREATED DISTILLATE AROMATIC EXTRACTS MARKET FOR TIRES & TUBES MARKET (USD MILLION) (2020-2027) 30
      5. TABLE 4 GLOBAL TREATED DISTILLATE AROMATIC EXTRACTS MARKET FOR TIRES & TUBES MARKET (KT) (2020-2027) 30
      6. TABLE 5 GLOBAL TREATED DISTILLATE AROMATIC EXTRACTS MARKET FOR BELTING & HOUSES MARKET (USD MILLION) (2020-2027) 31
      7. TABLE 6 GLOBAL TREATED DISTILLATE AROMATIC EXTRACTS MARKET FOR BELTING & HOUSES MARKET (KT) (2020-2027) 31
      8. TABLE 7 GLOBAL TREATED DISTILLATE AROMATIC EXTRACTS MARKET FOR BATTERY CONTAINERS MARKET (USD MILLION) (2020-2027) 32
      9. TABLE 8 GLOBAL TREATED DISTILLATE AROMATIC EXTRACTS MARKET FOR BATTERY CONTAINERS MARKET (KT) (2020-2027) 32
      10. TABLE 9 GLOBAL TREATED DISTILLATE AROMATIC EXTRACTS MARKET FOR EXTRUDED PRODUCTS MARKET (USD MILLION) (2020-2027) 33
      11. TABLE 10 GLOBAL TREATED DISTILLATE AROMATIC EXTRACTS MARKET FOR EXTRUDED PRODUCTS MARKET (KT) (2020-2027) 33
      12. TABLE 11 GLOBAL TREATED DISTILLATE AROMATIC EXTRACTS MARKET FOR OTHERS MARKET (USD MILLION) (2020-2027) 34
      13. TABLE 12 GLOBAL TREATED DISTILLATE AROMATIC EXTRACTS MARKET FOR OTHERS MARKET (KT) (2020-2027) 35
      14. TABLE 13 GLOBAL TREATED DISTILLATE AROMATIC EXTRACTS MARKET, BY REGION 2020-2027 (USD MILLION) 37
      15. TABLE 14 GLOBAL TREATED DISTILLATE AROMATIC EXTRACTS MARKET, BY REGION 2020-2027 (KT) 37
      16. TABLE 15 NORTH AMARICA TREATED DISTILLATE AROMATIC EXTRACTS MARKET BY COUNTRIES (2020-2027) (USD MILLION) 38
      17. TABLE 16 NORTH AMARICA TREATED DISTILLATE AROMATIC EXTRACTS MARKET BY COUNTRIES (2020-2027) (KT) 38
      18. TABLE 17 NORTH AMARICA TREATED DISTILLATE AROMATIC EXTRACTS MARKET BY APPLICATION (2020-2027) (USD MILLION) 38
      19. TABLE 18 NORTH AMARICA TREATED DISTILLATE AROMATIC EXTRACTS MARKET BY APPLICATION (2020-2027) (KT) 39
      20. TABLE 19 U.S. TREATED DISTILLATE AROMATIC EXTRACTS MARKET BY APPLICATION (2020-2027) (USD MILLION) 39
      21. TABLE 20 U.S. TREATED DISTILLATE AROMATIC EXTRACTS MARKET BY APPLICATION (2020-2027) (KT) 40
      22. TABLE 21 U.S. TREATED DISTILLATE AROMATIC EXTRACTS MARKET BY APPLICATION (2020-2027) (USD MILLION) 40
      23. TABLE 22 NORTH AMARICA TREATED DISTILLATE AROMATIC EXTRACTS MARKET BY APPLICATION (2020-2027) (KT) 41
      24. TABLE 23 EUROPE TREATED DISTILLATE AROMATIC EXTRACTS MARKET BY COUNTRIES (2020-2027) (USD MILLION) 42
      25. TABLE 24 EUROPE TREATED DISTILLATE AROMATIC EXTRACTS MARKET BY COUNTRIES (2020-2027) (KT) 42
      26. TABLE 25 EUROPE TREATED DISTILLATE AROMATIC EXTRACTS MARKET BY APPLICATION (2020-2027) (USD MILLION) 43
      27. TABLE 26 EUROPE TREATED DISTILLATE AROMATIC EXTRACTS MARKET BY APPLICATION (2020-2027) (KT) 43
      28. TABLE 27 GERMANY TREATED DISTILLATE AROMATIC EXTRACTS MARKET BY APPLICATION (2020-2027) (USD MILLION) 44
      29. TABLE 28 GERMANY TREATED DISTILLATE AROMATIC EXTRACTS MARKET BY APPLICATION (2020-2027) (KT) 44
      30. TABLE 29 FRANCE TREATED DISTILLATE AROMATIC EXTRACTS MARKET BY APPLICATION (2020-2027) (USD MILLION) 45
      31. TABLE 30 FRANCE TREATED DISTILLATE AROMATIC EXTRACTS MARKET BY APPLICATION (2020-2027) (KT) 45
      32. TABLE 31 UK TREATED DISTILLATE AROMATIC EXTRACTS MARKET BY APPLICATION (2020-2027) (USD MILLION) 46
      33. TABLE 32 UK TREATED DISTILLATE AROMATIC EXTRACTS MARKET BY APPLICATION (2020-2027) (KT) 46
      34. TABLE 33 ITALY TREATED DISTILLATE AROMATIC EXTRACTS MARKET BY APPLICATION (2020-2027) (USD MILLION) 47
      35. TABLE 34 ITALYTREATED DISTILLATE AROMATIC EXTRACTS MARKET BY APPLICATION (2020-2027) (KT) 47
      36. TABLE 35 SPAIN TREATED DISTILLATE AROMATIC EXTRACTS MARKET BY APPLICATION (2020-2027) (USD MILLION) 48
      37. TABLE 36 SPAIN TREATED DISTILLATE AROMATIC EXTRACTS MARKET BY APPLICATION (2020-2027) (KT) 48
      38. TABLE 37 REST OF THE ASIA PACIFIC TREATED DISTILLATE AROMATIC EXTRACTS MARKET BY APPLICATION (2020-2027) (USD MILLION) 49
      39. TABLE 38 REST OF THE ASIA PACIFIC TREATED DISTILLATE AROMATIC EXTRACTS MARKET BY APPLICATION (2020-2027) (KT) 49
      40. TABLE 39 ASIA PACIFIC TREATED DISTILLATE AROMATIC EXTRACTS MARKET BY COUNTRIES (2020-2027) (USD MILLION) 50
      41. TABLE 40 ASIA PACIFIC TREATED DISTILLATE AROMATIC EXTRACTS MARKET BY COUNTRIES (2020-2027) (KT) 50
      42. TABLE 41 ASIA PACIFIC TREATED DISTILLATE AROMATIC EXTRACTS MARKET BY APPLICATION (2020-2027) (USD MILLION) 51
      43. TABLE 42 ASIA PACIFIC TREATED DISTILLATE AROMATIC EXTRACTS MARKET BY APPLICATION (2020-2027) (KT) 51
      44. TABLE 43 ASIA PACIFIC TREATED DISTILLATE AROMATIC EXTRACTS MARKET BY APPLICATION (2020-2027) (USD MILLION) 52
      45. TABLE 44 ASIA PACIFIC TREATED DISTILLATE AROMATIC EXTRACTS MARKET BY APPLICATION (2020-2027) (KT) 52
      46. TABLE 45 INDIATREATED DISTILLATE AROMATIC EXTRACTS MARKET BY APPLICATION (2020-2027) (USD MILLION) 53
      47. TABLE 46 INDIA TREATED DISTILLATE AROMATIC EXTRACTS MARKET BY APPLICATION (2020-2027) (KT) 53
      48. TABLE 47 JAPAN TREATED DISTILLATE AROMATIC EXTRACTS MARKET BY APPLICATION (2020-2027) (USD MILLION) 54
      49. TABLE 48 JAPAN TREATED DISTILLATE AROMATIC EXTRACTS MARKET BY APPLICATION (2020-2027) (KT) 54
      50. TABLE 49 SOUTH KOREATREATED DISTILLATE AROMATIC EXTRACTS MARKET BY APPLICATION (2020-2027) (USD MILLION) 55
      51. TABLE 50 SOUTH KOREA TREATED DISTILLATE AROMATIC EXTRACTS MARKET BY APPLICATION (2020-2027) (KT) 55
      52. TABLE 51 REST OF THE ASIA PACIFIC TREATED DISTILLATE AROMATIC EXTRACTS MARKET BY APPLICATION (2020-2027) (USD MILLION) 56
      53. TABLE 52 REST OF THEASIA PACIFIC TREATED DISTILLATE AROMATIC EXTRACTS MARKET BY APPLICATION (2020-2027) (KT) 56
      54. TABLE 53 LATIN AMERICA TREATED DISTILLATE AROMATIC EXTRACTS MARKET BY COUNTRIES (2020-2027) (USD MILLION) 57
      55. TABLE 54 LATIN AMERICA TREATED DISTILLATE AROMATIC EXTRACTS MARKET BY COUNTRIES (2020-2027) (KT) 57
      56. TABLE 55 LATIN AMERICA TREATED DISTILLATE AROMATIC EXTRACTS MARKET BY APPLICATION (2020-2027) (USD MILLION) 58
      57. TABLE 56 LATIN AMERICA TREATED DISTILLATE AROMATIC EXTRACTS MARKET BY APPLICATION (2020-2027) (KT) 58
      58. TABLE 57 BRAZIL TREATED DISTILLATE AROMATIC EXTRACTS MARKET BY APPLICATION (2020-2027) (USD MILLION) 59
      59. TABLE 58 BRAZIL TREATED DISTILLATE AROMATIC EXTRACTS MARKET BY APPLICATION (2020-2027) (KT) 59
      60. TABLE 59 MEXICO TREATED DISTILLATE AROMATIC EXTRACTS MARKET BY APPLICATION (2020-2027) (USD MILLION) 60
      61. TABLE 60 MEXICO TREATED DISTILLATE AROMATIC EXTRACTS MARKET BY APPLICATION (2020-2027) (KT) 60
      62. TABLE 61 REST OF THE LATIN AMERICAN TREATED DISTILLATE AROMATIC EXTRACTS MARKET BY APPLICATION (2020-2027) (USD MILLION) 61
      63. TABLE 62 REST OF THE LATIN AMERICAN TREATED DISTILLATE AROMATIC EXTRACTS MARKET BY APPLICATION (2020-2027) (KT) 61
      64. TABLE 63 MIDDLE EAST &AFRICA TREATED DISTILLATE AROMATIC EXTRACTS MARKET BY COUNTRIES (2020-2027) (USD MILLION) 62
      65. TABLE 64 MIDDLE EAST &AFRICA TREATED DISTILLATE AROMATIC EXTRACTS MARKET BY COUNTRIES (2020-2027) (KT) 62
      66. TABLE 65 MIDDLE EAST &AFRICA TREATED DISTILLATE AROMATIC EXTRACTS MARKET BY APPLICATION (2020-2027) (USD MILLION) 63
      67. TABLE 66 MIDDLE EAST &AFRICA TREATED DISTILLATE AROMATIC EXTRACTS MARKET BY APPLICATION (2020-2027) (KT) 63
      68. TABLE 67 SAUDIA ARABIATREATED DISTILLATE AROMATIC EXTRACTS MARKET BY APPLICATION (2020-2027) (USD MILLION) 64
      69. TABLE 68 SAUDIA ARABIA TREATED DISTILLATE AROMATIC EXTRACTS MARKET BY APPLICATION (2020-2027) (KT) 64
      70. TABLE 69 UAE TREATED DISTILLATE AROMATIC EXTRACTS MARKET BY APPLICATION (2020-2027) (USD MILLION) 65
      71. TABLE 70 UAE TREATED DISTILLATE AROMATIC EXTRACTS MARKET BY APPLICATION (2020-2027) (KT) 65
      72. TABLE 71 REST OF THE MIDDLE EAST &AFRICA TREATED DISTILLATE AROMATIC EXTRACTS MARKET BY APPLICATION (2020-2027) (USD MILLION) 66
      73. TABLE 72 REST OF THE MIDDLE EAST &AFRICA TREATED DISTILLATE AROMATIC EXTRACTS MARKET BY APPLICATION (2020-2027) (KT) 66
      74. TABLE 73 KEY DEVELOPMENTS (2020-2027) 67 11 List Of Figures
      75. FIGURE 1 TOP DOWN & BOTTOM UP APPROACH 17
      76. FIGURE 2 FORECAST MODEL 18
      77. FIGURE 3 MARKEY DYNAMICS IMPACT 19
      78. FIGURE 4 GLOBAL TREATED DISTILLATE AROMATIC EXTRACTS MARKET, BY APPLICATION 2020-2027 (USD MILLION) 28
      79. FIGURE 5 GLOBAL TREATED DISTILLATE AROMATIC EXTRACTS MARKET, BY APPLICATION 2020-2027 (KT) 29
      80. FIGURE 6 GLOBAL TREATED DISTILLATE AROMATIC EXTRACTS MARKET, BY REGION (2016) (%) 36
      81. FIGURE 7 GLOBAL TDAE VALUE CAGR (%), BY REGION 79

    Treated Distillate Aromatic Extracts (TDAE) Market Segmentation

    Market Segmentation Overview

    • Detailed segmentation data will be available in the full report
    • Comprehensive analysis by multiple parameters
    • Regional and country-level breakdowns
    • Market size forecasts by segment
    Infographic

    Free Sample Request

    Kindly complete the form below to receive a free sample of this Report

    Get Free Sample

    Customer Strories

    “I am very pleased with how market segments have been defined in a relevant way for my purposes (such as "Portable Freezers & refrigerators" and "last-mile"). In general the report is well structured. Thanks very much for your efforts.”

    Victoria Milne

    Founder
    Case Study
    Chemicals and Materials