Request Free Sample ×

Kindly complete the form below to receive a free sample of this Report

* Please use a valid business email

Leading companies partner with us for data-driven Insights

clients tt-cursor
Hero Background

US Molecular Modeling Market

ID: MRFR/HC/17902-HCR
100 Pages
Vikita Thakur, Garvit Vyas
Last Updated: April 06, 2026

分子建模市场研究报告信息按产品(软件、服务)、按应用(药物开发、药物发现)、按最终用户(制药和生物技术公司、研究和学术中心)和按地区(北美、欧洲、亚太地区和世界其他地区)划分 – 市场预测至 2032 年。

分享
Download PDF ×

We do not share your information with anyone. However, we may send you emails based on your report interest from time to time. You may contact us at any time to opt-out.

US Molecular Modeling Market Infographic
Purchase Options

分子建模市场概览

p2022 年分子建模市场规模价值 2.5 亿美元。预计分子建模市场行业将从 2023 年的 2.89825 亿美元增长到 2032 年的 9.4558 亿美元,预测期内(2023 - 2032 年)的复合年增长率 (CAGR) 为 16.26%。慢性病患病率的上升导致了药物开发的增加,制药和生物技术公司对研发的投资增加是促进市场增长的主要市场驱动力。

分子建模市场

来源二手研究、一手研究、MRFR 数据库和分析师评论

分子建模市场趋势

p药物设计的技术进步正在推动市场增长

分子建模是用于药物设计的一种强大技术。开发具有治疗应用的新药是制药行业的一个重要过程。在药物设计和发现中,实验和计算技术代表了互补的方法。然而,分子建模是一种安全且易于使用的工具,它可以帮助使用三维结构来研究、解释、说明和识别分子特性。

例如,3D 建模软件是一个强大的工具,可以帮助许多专业人士创建复杂的 3D 图形并可视化他们的工作。在药物设计过程中,分子建模试图预测两个或多个组成分子之间形成的分子间复合物的结构。分子建模技术用于计算化学、计算生物学和材料科学的各个领域,以研究从大型生物分子到小型化学系统的分子系统。这一因素推动了预测期内的市场复合年增长率。

慢性病患病率的上升也有望推动更好、更先进的治疗方法的发展。在这种情况下,预计分子建模市场将在预测期内增长。此外,肝炎和人乳头瘤病毒 (HPV) 等致癌感染约占低收入和中低收入国家癌症病例的 30%。慢性病患病率的不断上升,以及药物研发在提供廉价药物方面的额外优势,为分子建模市场的收入增长铺平了道路。

分子建模市场细分洞察

h3分子建模产品洞察 p根据产品,分子建模市场细分包括软件和服务。软件细分市场占据主导地位;该细分市场的增长归因于为分子建模和可视化开发的软件工具数量的不断增长。此外,预计越来越多致力于开发分子建模软件的公司将为该细分市场的分子建模市场增长做出贡献。

图 1 2022 年及以后按产品划分的分子建模市场2032 年(十亿美元)

分子建模市场,按产品,2022 年和 2032 年

来源:二手资料研究、一手资料研究、MRFR 数据库和分析师评论

分子建模应用洞察

p根据应用,分子建模市场细分包括药物开发和药物发现。药物开发领域占据市场主导地位;各种疾病的日益流行和对现有治疗药物的耐药性日益增强,增加了对识别新药物靶点的需求。开发新药物分子的平均成本和开展研究技术的时间相当高。鉴于此,许多制药公司正在采用分子建模技术进行药物开发。这一因素影响了分子建模市场中这一细分市场的增长。

分子建模最终用户洞察

p根据最终用户,分子建模市场细分包括制药和生物技术公司、研究和学术中心。制药和生物技术公司细分市场占据主导地位,因为药物发现和开发领域的研发活动日益增多,制药和生物技术公司越来越多地应用分子建模,预计这将推动该细分市场的增长。

分子建模区域洞察

p按地区划分,该研究提供了北美、欧洲、亚太地区和世界其他地区的市场洞察。北美分子建模市场将占据主导地位,因为知名研究机构和学术组织的存在促进了研究科学家的开放获取,从而促进了该地区市场的增长。

此外,市场报告中研究的主要国家是美国、加拿大、德国、法国、英国、意大利、西班牙、中国、日本、印度、澳大利亚、韩国和巴西。

图 2 2022 年各地区分子建模市场份额(%)

2022 年各地区分子建模市场份额

来源二手研究、一手研究、 MRFR 数据库和分析师评论

欧洲的分子建模市场占据第二大市场份额。这是由于研究资金的增加以及与用于建模或模拟分子行为的理论方法和计算技术相关的临床试验数量的增加。

此外,德国分子建模市场占有最大的市场份额,英国分子建模市场是欧洲地区增长最快的市场。

预计亚太地区分子建模市场将在 2023 年至 2032 年期间以最快的复合年增长率增长。这是由于可支配收入的增加、研究机构数量的增加、合同研究组织数量的增加以及医疗保健基础设施的改善等因素。此外,中国的分子建模市场占有最大的市场份额,印度分子建模市场是亚太地区增长最快的市场。

分子建模主要市场参与者竞争洞察

领先的市场参与者正在大力投资研发,以扩展其产品线,这将有助于分子建模市场进一步增长。市场参与者也在开展各种战略活动以扩大其影响力,重要的市场发展包括新产品发布、合同协议、并购、增加投资以及与其他组织的合作。分子建模行业必须提供具有成本效益的产品,才能在竞争更激烈、不断增长的市场环境中扩张和生存。

在分子建模行业中,制造商采用的本地化生产以最大限度地降低运营成本是其使客户受益并扩大市场份额的关键商业策略之一。近年来,分子建模行业提供了一些最重要的医疗优势。美洲、欧洲、亚太、中东和非洲的分子建模市场的主要参与者包括:Simulations Plus, Inc(美国)、剑桥晶体学数据中心(英国)、Optibrium(英国)、Cresset(英国)和BioSolvelT GmbH。 (德国)、OpenEye Scientific Software(美国)、Chemical Computing Group(加拿大)、Acellera Ltd(伦敦)、Dassault Systèmes(法国)、Schrödinger, LLC(美国)、Certara, L.P(美国)等公司正试图通过投资研发业务来增加市场需求。

Simulations Plus, Inc. 为制药和生物技术、工业化学品、化妆品、食品配料和除草剂行业开发吸收、分布、代谢、排泄和毒性建模和模拟软件。Simulation Plus(美国)发布了 Gastro Plus 9.8.1 版。此版本增加了几项重要的新功能,包括对群体模拟、溶解、吸收、PBPK 模型和药物相互作用的改进。

Open Eye Scientific Software 是一家美国软件公司,由 Anthony Nicholls 于 1997 年创立。它开发大规模分子建模应用程序和工具包。 Open Eye Scientific(美国)宣布将于 2020 年发布 Open Eye 应用程序和工具包。它旨在缩短大规模构象异构体生成的运行时间,并包含一个包含超过 500,000 个片段的增强型片段库。

分子建模市场的主要公司包括

    • Simulations Plus
    • Inc(美国)
    • 剑桥晶体学数据中心(英国)
    • Optibrium(英国)
    • BioSolvelT GmbH(德国)
    • OpenEye Scientific Software(美国)
    • Chemical Computing Group(加拿大)
    • Acellera Ltd(伦敦)
    • Dassault Systèmes(法国)
    • Schrödinger LLC(美国)
p分子建模行业发展

2021 年 1 月  emCresset(英国)发布了用于 KNIME 和 Pipeline Pilot 的 Cresset 工作流组件 V2.6 版本适用于所有桌面解决方案的环境。此版本包含新的“对接”功能,显著增强了 Spark 组件的性能。

2020 年 12 月 emOpen Eye Scientific(美国)宣布发布 Open Eye 应用程序和工具包 2020。它旨在减少大规模构象生成的运行时间,并包含一个包含超过 500,000 个片段的增强片段库。

2020 年 11 月 emCresset(英国)发布了新版本的 Spark V10.6。此最新版本包含一项新的对接功能,使用户能够找到现有起始分子或参考分子之前未映射的新结果。

分子建模市场细分

h3分子建模产品展望 ul
  • 软件
  • 服务
h3分子建模应用展望 ul
  • 药物开发
h3分子建模最终用户展望 ul
  • 制药和生物技术公司
  • 研究与学术中心
h3分子建模区域展望 ul
  • 北美
    • 美国
    • 加拿大
  • 欧洲
    • 德国
    • 法国
    • 英国
    • 意大利
    • 西班牙
    • 其余部分欧洲
  • 亚太地区
    • 中国
    • 日本
    • 印度
    • 澳大利亚
    • 韩国
    • 澳大利亚
    • 亚太地区其他地区
  • 世界其他地区
    • 中东
    • 非洲
    • 拉丁美洲

FAQs

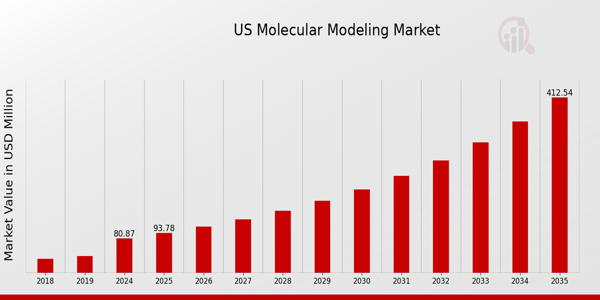
What was the market valuation of the US molecular modeling market in 2024?

The market valuation was $95.0 Million in 2024.

What is the projected market valuation for the US molecular modeling market by 2035?

The projected market valuation for 2035 is $500.0 Million.

What is the expected CAGR for the US molecular modeling market during the forecast period 2025 - 2035?

The expected CAGR for the market during the forecast period is 16.3%.

Which companies are considered key players in the US molecular modeling market?

Key players include Schrodinger, Accelrys, Biovia, ChemAxon, Molecular Simulations, OpenEye Scientific Software, Cresset, Simulations Plus, and Zinc.

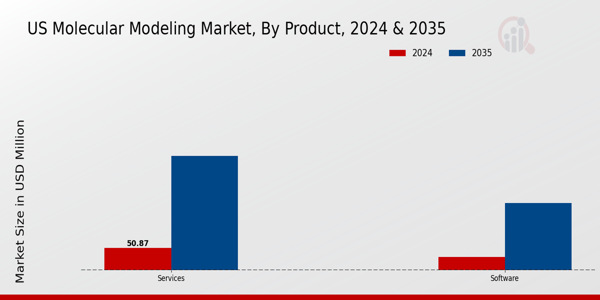
What are the main product segments in the US molecular modeling market?

The main product segments are Software, valued at $40.0 Million to $200.0 Million, and Services, valued at $55.0 Million to $300.0 Million.

What applications are driving growth in the US molecular modeling market?

The primary applications are Drug Development, valued at $40.0 Million to $200.0 Million, and Drug Discovery, valued at $55.0 Million to $300.0 Million.

Who are the primary end users of molecular modeling in the US?

Primary end users include Pharmaceutical & Biotechnology Companies, valued at $60.0 Million to $320.0 Million, and Research & Academic Centers, valued at $35.0 Million to $180.0 Million.

How does the market valuation in 2024 compare to the projected valuation in 2035?

The market valuation in 2024 was $95.0 Million, which is expected to grow to $500.0 Million by 2035.

What trends are influencing the growth of the US molecular modeling market?

Trends include advancements in software capabilities and increasing investments in drug discovery and development.

What is the significance of the projected growth from 2025 to 2035 for stakeholders?

The projected growth indicates substantial opportunities for stakeholders, with a potential market expansion driven by innovation and demand.

作者
Author
Author Profile
Vikita Thakur LinkedIn
Senior Research Analyst
She holds an experience of about 5+ years in market research and business consulting projects for sectors such as life sciences, medical devices, and healthcare IT. She possesses a robust background in data analysis, market estimation, competitive intelligence, pipeline analysis market trend identification, and consumer behavior insights. Her expertise lies in technical Sales support, client interaction and project management, designing and implementing market research studies, conducting competitive analysis, and synthesizing complex data into actionable recommendations that drive business growth.
Co-Author
Co-Author Profile
Garvit Vyas LinkedIn
Vice President - Operations
Garvit Vyas is a Research Analyst with experience in working across multiple industry domains in the market research sector. Over the past four years, he has been actively involved in analyzing diverse markets, gathering industry insights, and contributing to the development of comprehensive research reports. His work includes studying market trends, evaluating competitive landscapes, and supporting data-driven business insights. In the early phase of his career, Garvit worked on cross-domain research projects, which helped him build a strong foundation in market analysis, data interpretation, and industry intelligence across various sectors. Later, he transitioned into the Quality Control (QC) function, where he focuses on reviewing and refining research reports and marketing collaterals to ensure accuracy, consistency, and high editorial standards. His responsibilities include validating research data, improving report structure, and maintaining the overall quality of published content. Garvit is committed to maintaining strong research integrity and delivering reliable insights that support informed business decision-making.
发表评论
下载免费样本

请填写以下表格以获取本报告的免费样本

Compare Licence

×
Features License Type
Single User Multiuser License Enterprise User
Price $4,950 $5,950 $7,250
Maximum User Access Limit 1 User Upto 10 Users Unrestricted Access Throughout the Organization
Free Customization
Direct Access to Analyst
Deliverable Format
Platform Access
Discount on Next Purchase 10% 15% 15%
Printable Versions