Certified Global Research Member
Isomar fd.webp Wcrc 57.webp
Key Questions Answered
  • Global Market Outlook
  • In-depth analysis of global and regional trends
  • Analyze and identify the major players in the market, their market share, key developments, etc.
  • To understand the capability of the major players based on products offered, financials, and strategies.
  • Identify disrupting products, companies, and trends.
  • To identify opportunities in the market.
  • Analyze the key challenges in the market.
  • Analyze the regional penetration of players, products, and services in the market.
  • Comparison of major players’ financial performance.
  • Evaluate strategies adopted by major players.
  • Recommendations
Why Choose Market Research Future?
  • Vigorous research methodologies for specific market.
  • Knowledge partners across the globe
  • Large network of partner consultants.
  • Ever-increasing/ Escalating data base with quarterly monitoring of various markets
  • Trusted by fortune 500 companies/startups/ universities/organizations
  • Large database of 5000+ markets reports.
  • Effective and prompt pre- and post-sales support.

Zero-Touch Provisioning Market Research Report Information By Component (Platform and Services), Device Type (Routers, Switches, Access Points, Firewalls, IoT Devices, and Others), Network Complexity (Multi-Vendor Environment, Complex Network Architecture, and Dynamic Network Environment), Enterprise Size (Large Enterprises and Small & Medium Enterprises), Industry (IT & Telecommunications, Manufacturing, Healthcare, Retail, and Others), and By Region (North America, Europe, Asia-Pacific, And Rest Of The World) – Forecast Till 2032


ID: MRFR/ICT/10185-HCR | 128 Pages | Author: Shubham Munde| April 2024

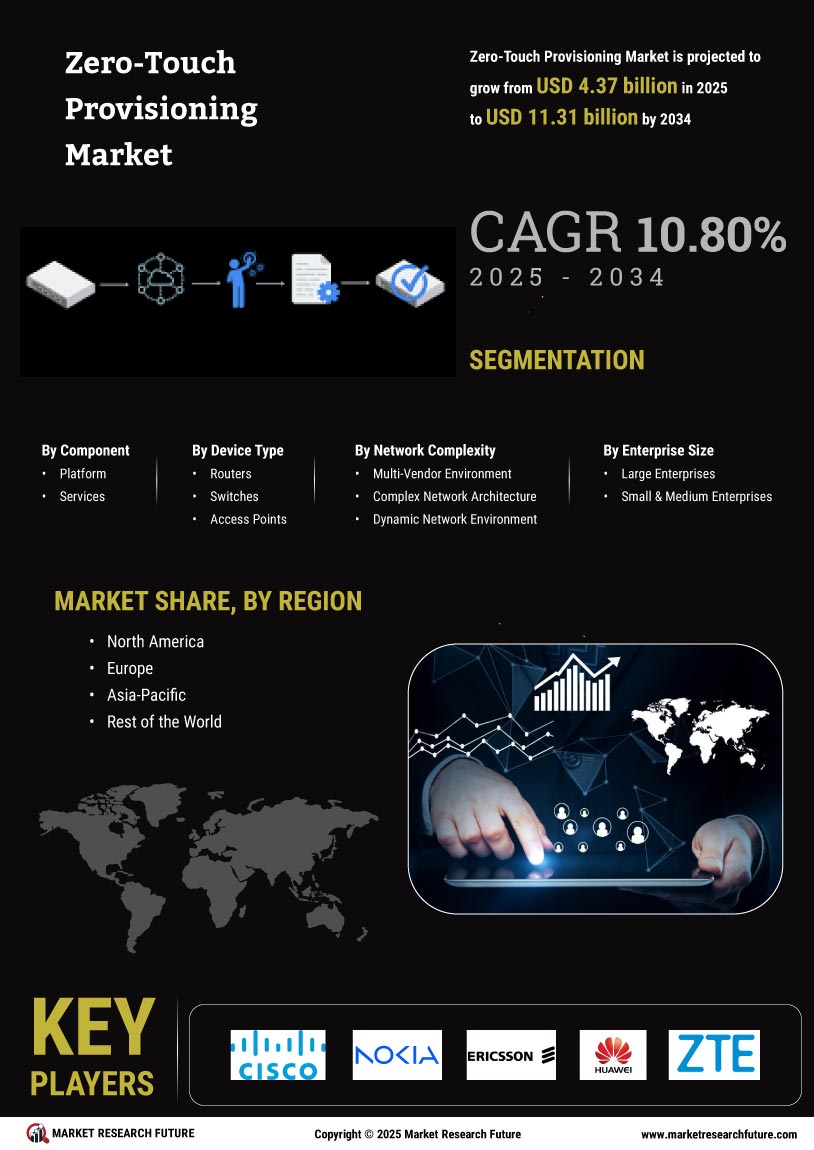
Zero-Touch Provisioning Market Segmentation


Zero-Touch Provisioning Component Outlook (USD Billion, 2018-2032)


  • Platform


  • Services


Zero-Touch Provisioning Device Type Outlook (USD Billion, 2018-2032)


  • Routers


  • Switches


  • Access Points


  • Firewalls


  • IoT Devices


  • Others


Zero-Touch Provisioning Network Complexity Outlook (USD Billion, 2018-2032)


  • Multi-Vendor Environment


  • Complex Network Architecture


  • Dynamic Network Environment


Zero-Touch Provisioning Enterprise Size Outlook (USD Billion, 2018-2032)


  • Large Enterprises


  • Small & Medium Enterprises


Zero-Touch Provisioning Industry Outlook (USD Billion, 2018-2032)


  • IT & Telecommunications


  • Manufacturing


  • Healthcare


  • Retail


  • Others


Zero-Touch Provisioning Regional Outlook (USD Billion, 2018-2032)


  • North America Outlook (USD Billion, 2018-2032)


    • Zero-Touch Provisioning by Component


      • Platform


      • Services


    • Zero-Touch Provisioning by Device Type


      • Routers


      • Switches


      • Access Points


      • Firewalls


      • IoT Devices


      • Others


    • Zero-Touch Provisioning by Network Complexity


      • Multi-Vendor Environment


      • Complex Network Architecture


      • Dynamic Network Environment


    • Zero-Touch Provisioning by Enterprise Size


      • Large Enterprises


      • Small & Medium Enterprises


    • Zero-Touch Provisioning by Industry


      • IT & Telecommunications


      • Manufacturing


      • Healthcare


      • Retail


      • Others


    • US Outlook (USD Billion, 2018-2032)


    • Zero-Touch Provisioning by Component


      • Platform


      • Services


    • Zero-Touch Provisioning by Device Type


      • Routers


      • Switches


      • Access Points


      • Firewalls


      • IoT Devices


      • Others


    • Zero-Touch Provisioning by Network Complexity


      • Multi-Vendor Environment


      • Complex Network Architecture


      • Dynamic Network Environment


    • Zero-Touch Provisioning by Enterprise Size


      • Large Enterprises


      • Small & Medium Enterprises


    • Zero-Touch Provisioning by Industry


      • IT & Telecommunications


      • Manufacturing


      • Healthcare


      • Retail


      • Others


    • Canada Outlook (USD Billion, 2018-2032)


    • Zero-Touch Provisioning by Component


      • Platform


      • Services


    • Zero-Touch Provisioning by Device Type


      • Routers


      • Switches


      • Access Points


      • Firewalls


      • IoT Devices


      • Others


    • Zero-Touch Provisioning by Network Complexity


      • Multi-Vendor Environment


      • Complex Network Architecture


      • Dynamic Network Environment


    • Zero-Touch Provisioning by Enterprise Size


      • Large Enterprises


      • Small & Medium Enterprises


    • Zero-Touch Provisioning by Industry


      • IT & Telecommunications


      • Manufacturing


      • Healthcare


      • Retail


      • Others


  • Europe Outlook (USD Billion, 2018-2032)


    • Zero-Touch Provisioning by Component


      • Platform


      • Services


    • Zero-Touch Provisioning by Device Type


      • Routers


      • Switches


      • Access Points


      • Firewalls


      • IoT Devices


      • Others


    • Zero-Touch Provisioning by Network Complexity


      • Multi-Vendor Environment


      • Complex Network Architecture


      • Dynamic Network Environment


    • Zero-Touch Provisioning by Enterprise Size


      • Large Enterprises


      • Small & Medium Enterprises


    • Zero-Touch Provisioning by Industry


      • IT & Telecommunications


      • Manufacturing


      • Healthcare


      • Retail


Leading companies partner with us for data-driven Insights
client_1 client_2 client_3 client_4 client_5 client_6 client_7 client_8 client_9 client_10
Please fill in Business Email for Quick Response

TABLE OF CONTENTS

1. EXECUTIVE SUMMARY

2. MARKET INTRODUCTION

2.1. Definition

2.2. Scope of the Study

2.2.1. Research Objective

2.2.2. Assumptions

2.2.3. Limitations

3. RESEARCH METHODOLOGY

3.1. Overview

3.2. Data Mining

3.3. Secondary Research

3.4. Primary Research

3.4.1. Primary Interviews and Information Gathering Process

3.4.2. Breakdown of Primary Respondents

3.5. Forecasting Model

3.6. Market Size Estimation

3.6.1. Bottom-Up Approach

3.6.2. Top-Down Approach

3.7. Data Triangulation

3.8. Validation

4. MARKET DYNAMICS

4.1. Overview

4.2. Drivers

4.3. Restraints

4.4. Opportunities

5. MARKET FACTOR ANALYSIS

5.1. Value Chain Analysis

5.2. Porter’s Five Forces Analysis

5.2.1. Bargaining Power of Suppliers

5.2.2. Bargaining Power of Buyers

5.2.3. Threat of New Entrants

5.2.4. Threat of Substitutes

5.2.5. Intensity of Rivalry

5.3. COVID-19 Impact Analysis

5.3.1. Market Impact Analysis

5.3.2. Regional Impact

5.3.3. Opportunity and Threat Analysis

6. GLOBAL ZERO-TOUCH PROVISIONING MARKET, BY COMPONENT

6.1. Overview

6.2. Platform

6.3. Services

7. GLOBAL ZERO-TOUCH PROVISIONING MARKET, BY DEVICE TYPE

7.1. Overview

7.2. Routers

7.3. Switches

7.4. Access Points

7.5. Firewalls

7.6. IoT Devices

7.7. Others

8. GLOBAL ZERO-TOUCH PROVISIONING MARKET, BY NETWORK COMPLEXITY

8.1. Overview

8.2. Multi-Vendor Environment

8.3. Complex Network Architecture

8.4. Dynamic Network Environment

9. GLOBAL ZERO-TOUCH PROVISIONING MARKET, BY ENTERPRISE SIZE

9.1. Overview

9.2. Large Enterprises

9.3. Small & Medium Enterprises

10. GLOBAL ZERO-TOUCH PROVISIONING MARKET, BY INDUSTRY

10.1. Overview

10.2. IT & Telecommunications

10.3. Manufacturing

10.4. Healthcare

10.5. Retail

10.6. Others

11. GLOBAL ZERO-TOUCH PROVISIONING MARKET, BY REGION

11.1. Overview

11.2. North America

11.2.1. U.S.

11.2.2. Canada

11.3. Europe

11.3.1. Germany

11.3.2. France

11.3.3. U.K

11.3.4. Italy

11.3.5. Spain

11.3.6. Rest of Europe

11.4. Asia-Pacific

11.4.1. China

11.4.2. India

11.4.3. Japan

11.4.4. South Korea

11.4.5. Australia

11.4.6. Rest of Asia-Pacific

11.5. Rest of the World

11.5.1. Middle East

11.5.2. Africa

11.5.3. Latin America

12. COMPETITIVE LANDSCAPE

12.1. Overview

12.2. Competitive Analysis

12.3. Market Share Analysis

12.4. Major Growth Strategy in the Global Zero-Touch Provisioning Market,

12.5. Competitive Benchmarking

12.6. Leading Players in Terms of Number of Developments in the Global Zero-Touch Provisioning Market,

12.7. Key developments and Growth Strategies

12.7.1. New Component Launch/Device Type Deployment

12.7.2. Merger & Acquisitions

12.7.3. Joint Ventures

12.8. Major Players Financial Matrix

12.8.1. Sales & Operating Income, 2022

12.8.2. Major Players R&D Expenditure. 2022

13. COMPANY PROFILES

13.1. CISCO SYSTEMS, INC.

13.1.1. Company Overview

13.1.2. Financial Overview

13.1.3. Components Offered

13.1.4. Key Developments

13.1.5. SWOT Analysis

13.1.6. Key Strategies

13.2. Nokia Corporation

13.2.1. Company Overview

13.2.2. Financial Overview

13.2.3. Components Offered

13.2.4. Key Developments

13.2.5. SWOT Analysis

13.2.6. Key Strategies

13.3. Telefonaktiebolaget LM Ericsson

13.3.1. Company Overview

13.3.2. Financial Overview

13.3.3. Components Offered

13.3.4. Key Developments

13.3.5. SWOT Analysis

13.3.6. Key Strategies

13.4. Huawei Technologies Co., Ltd.

13.4.1. Company Overview

13.4.2. Financial Overview

13.4.3. Components Offered

13.4.4. Key Developments

13.4.5. SWOT Analysis

13.4.6. Key Strategies

13.5. ZTE Corporation

13.5.1. Company Overview

13.5.2. Financial Overview

13.5.3. Components Offered

13.5.4. Key Developments

13.5.5. SWOT Analysis

13.5.6. Key Strategies

13.6. JUNIPER NETWORKS, INC.

13.6.1. Company Overview

13.6.2. Financial Overview

13.6.3. Components Offered

13.6.4. Key Developments

13.6.5. SWOT Analysis

13.6.6. Key Strategies

13.7. Hewlett Packard Enterprise Development LP

13.7.1. Company Overview

13.7.2. Financial Overview

13.7.3. Components Offered

13.7.4. Key Developments

13.7.5. SWOT Analysis

13.7.6. Key Strategies

13.8. Arista Networks, Inc.

13.8.1. Company Overview

13.8.2. Financial Overview

13.8.3. Components Offered

13.8.4. Key Developments

13.8.5. SWOT Analysis

13.8.6. Key Strategies

13.9. Extreme Networks

13.9.1. Company Overview

13.9.2. Financial Overview

13.9.3. Components Offered

13.9.4. Key Developments

13.9.5. SWOT Analysis

13.9.6. Key Strategies

14. APPENDIX

14.1. References

14.2. Related Reports

LIST OF TABLES

TABLE 1 GLOBAL ZERO-TOUCH PROVISIONING MARKET, SYNOPSIS, 2018-2032

TABLE 2 GLOBAL ZERO-TOUCH PROVISIONING MARKET, ESTIMATES & FORECAST, 2018-2032 (USD BILLION)

TABLE 3 GLOBAL ZERO-TOUCH PROVISIONING MARKET, BY COMPONENT, 2018-2032 (USD BILLION)

TABLE 4 GLOBAL ZERO-TOUCH PROVISIONING MARKET, BY DEVICE TYPE, 2018-2032 (USD BILLION)

TABLE 5 GLOBAL ZERO-TOUCH PROVISIONING MARKET, BY NETWORK COMPLEXITY, 2018-2032 (USD BILLION)

TABLE 6 GLOBAL ZERO-TOUCH PROVISIONING MARKET, BY ENTERPRISE SIZE, 2018-2032 (USD BILLION)

TABLE 7 GLOBAL ZERO-TOUCH PROVISIONING MARKET, BY INDUSTRY, 2018-2032 (USD BILLION)

TABLE 8 NORTH AMERICA ZERO-TOUCH PROVISIONING MARKET, BY COMPONENT, 2018-2032 (USD BILLION)

TABLE 9 NORTH AMERICA ZERO-TOUCH PROVISIONING MARKET, BY DEVICE TYPE, 2018-2032 (USD BILLION)

TABLE 10 NORTH AMERICA ZERO-TOUCH PROVISIONING MARKET, BY NETWORK COMPLEXITY, 2018-2032 (USD BILLION)

TABLE 11 NORTH AMERICA ZERO-TOUCH PROVISIONING MARKET, BY ENTERPRISE SIZE, 2018-2032 (USD BILLION)

TABLE 12 NORTH AMERICA ZERO-TOUCH PROVISIONING MARKET, BY INDUSTRY, 2018-2032 (USD BILLION)

TABLE 13 NORTH AMERICA ZERO-TOUCH PROVISIONING MARKET, BY COUNTRY, 2018-2032 (USD BILLION)

TABLE 14 U.S. ZERO-TOUCH PROVISIONING MARKET, BY COMPONENT, 2018-2032 (USD BILLION)

TABLE 15 U.S. ZERO-TOUCH PROVISIONING MARKET, BY DEVICE TYPE, 2018-2032 (USD BILLION)

TABLE 16 U.S. ZERO-TOUCH PROVISIONING MARKET, BY NETWORK COMPLEXITY, 2018-2032 (USD BILLION)

TABLE 17 U.S. ZERO-TOUCH PROVISIONING MARKET, BY ENTERPRISE SIZE, 2018-2032 (USD BILLION)

TABLE 18 U.S. ZERO-TOUCH PROVISIONING MARKET, BY INDUSTRY, 2018-2032 (USD BILLION)

TABLE 19 CANADA ZERO-TOUCH PROVISIONING MARKET, BY COMPONENT, 2018-2032 (USD BILLION)

TABLE 20 CANADA ZERO-TOUCH PROVISIONING MARKET, BY DEVICE TYPE, 2018-2032 (USD BILLION)

TABLE 21 CANADA ZERO-TOUCH PROVISIONING MARKET, BY NETWORK COMPLEXITY, 2018-2032 (USD BILLION)

TABLE 22 CANADA ZERO-TOUCH PROVISIONING MARKET, BY ENTERPRISE SIZE, 2018-2032 (USD BILLION)

TABLE 23 CANADA ZERO-TOUCH PROVISIONING MARKET, BY INDUSTRY, 2018-2032 (USD BILLION)

TABLE 24 EUROPE ZERO-TOUCH PROVISIONING MARKET, BY COMPONENT, 2018-2032 (USD BILLION)

TABLE 25 EUROPE ZERO-TOUCH PROVISIONING MARKET, BY DEVICE TYPE, 2018-2032 (USD BILLION)

TABLE 26 EUROPE ZERO-TOUCH PROVISIONING MARKET, BY NETWORK COMPLEXITY, 2018-2032 (USD BILLION)

TABLE 27 EUROPE ZERO-TOUCH PROVISIONING MARKET, BY ENTERPRISE SIZE, 2018-2032 (USD BILLION)

TABLE 28 EUROPE ZERO-TOUCH PROVISIONING MARKET, BY INDUSTRY, 2018-2032 (USD BILLION)

TABLE 29 EUROPE ZERO-TOUCH PROVISIONING MARKET, BY COUNTRY, 2018-2032 (USD BILLION)

TABLE 30 GERMANY ZERO-TOUCH PROVISIONING MARKET, BY COMPONENT, 2018-2032 (USD BILLION)

TABLE 31 GERMANY ZERO-TOUCH PROVISIONING MARKET, BY DEVICE TYPE, 2018-2032 (USD BILLION)

TABLE 32 GERMANY ZERO-TOUCH PROVISIONING MARKET, BY NETWORK COMPLEXITY, 2018-2032 (USD BILLION)

TABLE 33 GERMANY ZERO-TOUCH PROVISIONING MARKET, BY ENTERPRISE SIZE, 2018-2032 (USD BILLION)

TABLE 34 GERMANY ZERO-TOUCH PROVISIONING MARKET, BY INDUSTRY, 2018-2032 (USD BILLION)

TABLE 35 FRANCE ZERO-TOUCH PROVISIONING MARKET, BY COMPONENT, 2018-2032 (USD BILLION)

TABLE 36 FRANCE ZERO-TOUCH PROVISIONING MARKET, BY DEVICE TYPE, 2018-2032 (USD BILLION)

TABLE 37 FRANCE ZERO-TOUCH PROVISIONING MARKET, BY NETWORK COMPLEXITY, 2018-2032 (USD BILLION)

TABLE 38 FRANCE ZERO-TOUCH PROVISIONING MARKET, BY ENTERPRISE SIZE, 2018-2032 (USD BILLION)

TABLE 39 FRANCE ZERO-TOUCH PROVISIONING MARKET, BY INDUSTRY, 2018-2032 (USD BILLION)

TABLE 40 U.K ZERO-TOUCH PROVISIONING MARKET, BY COMPONENT, 2018-2032 (USD BILLION)

TABLE 41 U.K ZERO-TOUCH PROVISIONING MARKET, BY DEVICE TYPE, 2018-2032 (USD BILLION)

TABLE 42 U.K ZERO-TOUCH PROVISIONING MARKET, BY NETWORK COMPLEXITY, 2018-2032 (USD BILLION)

TABLE 43 U.K ZERO-TOUCH PROVISIONING MARKET, BY ENTERPRISE SIZE, 2018-2032 (USD BILLION)

TABLE 44 U.K ZERO-TOUCH PROVISIONING MARKET, BY INDUSTRY, 2018-2032 (USD BILLION)

TABLE 45 ITALY ZERO-TOUCH PROVISIONING MARKET, BY COMPONENT, 2018-2032 (USD BILLION)

TABLE 46 ITALY ZERO-TOUCH PROVISIONING MARKET, BY DEVICE TYPE, 2018-2032 (USD BILLION)

TABLE 47 ITALY ZERO-TOUCH PROVISIONING MARKET, BY NETWORK COMPLEXITY, 2018-2032 (USD BILLION)

TABLE 48 ITALY ZERO-TOUCH PROVISIONING MARKET, BY ENTERPRISE SIZE, 2018-2032 (USD BILLION)

TABLE 49 ITALY ZERO-TOUCH PROVISIONING MARKET, BY INDUSTRY, 2018-2032 (USD BILLION)

TABLE 50 SPAIN ZERO-TOUCH PROVISIONING MARKET, BY COMPONENT, 2018-2032 (USD BILLION)

TABLE 51 SPAIN ZERO-TOUCH PROVISIONING MARKET, BY DEVICE TYPE, 2018-2032 (USD BILLION)

TABLE 52 SPAIN ZERO-TOUCH PROVISIONING MARKET, BY NETWORK COMPLEXITY, 2018-2032 (USD BILLION)

TABLE 53 SPAIN ZERO-TOUCH PROVISIONING MARKET, BY ENTERPRISE SIZE, 2018-2032 (USD BILLION)

TABLE 54 SPAIN ZERO-TOUCH PROVISIONING MARKET, BY INDUSTRY, 2018-2032 (USD BILLION)

TABLE 55 REST OF EUROPE ZERO-TOUCH PROVISIONING MARKET, BY COMPONENT, 2018-2032 (USD BILLION)

TABLE 56 REST OF EUROPE ZERO-TOUCH PROVISIONING MARKET, BY DEVICE TYPE, 2018-2032 (USD BILLION)

TABLE 57 REST OF EUROPE ZERO-TOUCH PROVISIONING MARKET, BY NETWORK COMPLEXITY, 2018-2032 (USD BILLION)

TABLE 58 REST OF EUROPE ZERO-TOUCH PROVISIONING MARKET, BY ENTERPRISE SIZE, 2018-2032 (USD BILLION)

TABLE 59 REST OF EUROPE ZERO-TOUCH PROVISIONING MARKET, BY INDUSTRY, 2018-2032 (USD BILLION)

TABLE 60 ASIA PACIFIC ZERO-TOUCH PROVISIONING MARKET, BY COMPONENT, 2018-2032 (USD BILLION)

TABLE 61 ASIA PACIFIC ZERO-TOUCH PROVISIONING MARKET, BY DEVICE TYPE, 2018-2032 (USD BILLION)

TABLE 62 ASIA PACIFIC ZERO-TOUCH PROVISIONING MARKET, BY NETWORK COMPLEXITY, 2018-2032 (USD BILLION)

TABLE 63 ASIA PACIFIC ZERO-TOUCH PROVISIONING MARKET, BY ENTERPRISE SIZE, 2018-2032 (USD BILLION)

TABLE 64 ASIA PACIFIC ZERO-TOUCH PROVISIONING MARKET, BY INDUSTRY, 2018-2032 (USD BILLION)

TABLE 65 ASIA PACIFIC ZERO-TOUCH PROVISIONING MARKET, BY COUNTRY, 2018-2032 (USD BILLION)

TABLE 66 CHINA ZERO-TOUCH PROVISIONING MARKET, BY COMPONENT, 2018-2032 (USD BILLION)

TABLE 67 CHINA ZERO-TOUCH PROVISIONING MARKET, BY DEVICE TYPE, 2018-2032 (USD BILLION)

TABLE 68 CHINA ZERO-TOUCH PROVISIONING MARKET, BY NETWORK COMPLEXITY, 2018-2032 (USD BILLION)

TABLE 69 CHINA ZERO-TOUCH PROVISIONING MARKET, BY ENTERPRISE SIZE, 2018-2032 (USD BILLION)

TABLE 70 CHINA ZERO-TOUCH PROVISIONING MARKET, BY INDUSTRY, 2018-2032 (USD BILLION)

TABLE 71 JAPAN ZERO-TOUCH PROVISIONING MARKET, BY COMPONENT, 2018-2032 (USD BILLION)

TABLE 72 JAPAN ZERO-TOUCH PROVISIONING MARKET, BY DEVICE TYPE, 2018-2032 (USD BILLION)

TABLE 73 JAPAN ZERO-TOUCH PROVISIONING MARKET, BY NETWORK COMPLEXITY, 2018-2032 (USD BILLION)

TABLE 74 JAPAN ZERO-TOUCH PROVISIONING MARKET, BY ENTERPRISE SIZE, 2018-2032 (USD BILLION)

TABLE 75 JAPAN ZERO-TOUCH PROVISIONING MARKET, BY INDUSTRY, 2018-2032 (USD BILLION)

TABLE 76 INDIA ZERO-TOUCH PROVISIONING MARKET, BY COMPONENT, 2018-2032 (USD BILLION)

TABLE 77 INDIA ZERO-TOUCH PROVISIONING MARKET, BY DEVICE TYPE, 2018-2032 (USD BILLION)

TABLE 78 INDIA ZERO-TOUCH PROVISIONING MARKET, BY NETWORK COMPLEXITY, 2018-2032 (USD BILLION)

TABLE 79 INDIA ZERO-TOUCH PROVISIONING MARKET, BY ENTERPRISE SIZE, 2018-2032 (USD BILLION)

TABLE 80 INDIA ZERO-TOUCH PROVISIONING MARKET, BY INDUSTRY, 2018-2032 (USD BILLION)

TABLE 81 SOUTH KOREA ZERO-TOUCH PROVISIONING MARKET, BY COMPONENT, 2018-2032 (USD BILLION)

TABLE 82 SOUTH KOREA ZERO-TOUCH PROVISIONING MARKET, BY DEVICE TYPE, 2018-2032 (USD BILLION)

TABLE 83 SOUTH KOREA ZERO-TOUCH PROVISIONING MARKET, BY NETWORK COMPLEXITY, 2018-2032 (USD BILLION)

TABLE 84 SOUTH KOREA ZERO-TOUCH PROVISIONING MARKET, BY ENTERPRISE SIZE, 2018-2032 (USD BILLION)

TABLE 85 SOUTH KOREA ZERO-TOUCH PROVISIONING MARKET, BY INDUSTRY, 2018-2032 (USD BILLION)

TABLE 86 AUSTRALIA ZERO-TOUCH PROVISIONING MARKET, BY COMPONENT, 2018-2032 (USD BILLION)

TABLE 87 AUSTRALIA ZERO-TOUCH PROVISIONING MARKET, BY DEVICE TYPE, 2018-2032 (USD BILLION)

TABLE 88 AUSTRALIA ZERO-TOUCH PROVISIONING MARKET, BY NETWORK COMPLEXITY, 2018-2032 (USD BILLION)

TABLE 89 AUSTRALIA ZERO-TOUCH PROVISIONING MARKET, BY ENTERPRISE SIZE, 2018-2032 (USD BILLION)

TABLE 90 AUSTRALIA ZERO-TOUCH PROVISIONING MARKET, BY INDUSTRY, 2018-2032 (USD BILLION)

TABLE 91 REST OF ASIA PACIFIC ZERO-TOUCH PROVISIONING MARKET, BY COMPONENT, 2018-2032 (USD BILLION)

TABLE 92 REST OF ASIA PACIFIC ZERO-TOUCH PROVISIONING MARKET, BY DEVICE TYPE, 2018-2032 (USD BILLION)

TABLE 93 REST OF ASIA PACIFIC ZERO-TOUCH PROVISIONING MARKET, BY NETWORK COMPLEXITY, 2018-2032 (USD BILLION)

TABLE 94 REST OF ASIA PACIFIC ZERO-TOUCH PROVISIONING MARKET, BY ENTERPRISE SIZE, 2018-2032 (USD BILLION)

TABLE 95 REST OF ASIA PACIFIC ZERO-TOUCH PROVISIONING MARKET, BY INDUSTRY, 2018-2032 (USD BILLION)

TABLE 96 REST OF THE WORLD ZERO-TOUCH PROVISIONING MARKET, BY COMPONENT, 2018-2032 (USD BILLION)

TABLE 97 REST OF THE WORLD ZERO-TOUCH PROVISIONING MARKET, BY DEVICE TYPE, 2018-2032 (USD BILLION)

TABLE 98 REST OF THE WORLD ZERO-TOUCH PROVISIONING MARKET, BY NETWORK COMPLEXITY, 2018-2032 (USD BILLION)

TABLE 99 REST OF THE WORLD ZERO-TOUCH PROVISIONING MARKET, BY ENTERPRISE SIZE, 2018-2032 (USD BILLION)

TABLE 100 REST OF THE WORLD ZERO-TOUCH PROVISIONING MARKET, BY INDUSTRY, 2018-2032 (USD BILLION)

TABLE 101 REST OF THE WORLD ZERO-TOUCH PROVISIONING MARKET, BY COUNTRY, 2018-2032 (USD BILLION)

TABLE 102 MIDDLE EAST ZERO-TOUCH PROVISIONING MARKET, BY COMPONENT, 2018-2032 (USD BILLION)

TABLE 103 MIDDLE EAST ZERO-TOUCH PROVISIONING MARKET, BY DEVICE TYPE, 2018-2032 (USD BILLION)

TABLE 104 MIDDLE EAST ZERO-TOUCH PROVISIONING MARKET, BY NETWORK COMPLEXITY, 2018-2032 (USD BILLION)

TABLE 105 MIDDLE EAST ZERO-TOUCH PROVISIONING MARKET, BY ENTERPRISE SIZE, 2018-2032 (USD BILLION)

TABLE 106 MIDDLE EAST ZERO-TOUCH PROVISIONING MARKET, BY INDUSTRY, 2018-2032 (USD BILLION)

TABLE 107 AFRICA ZERO-TOUCH PROVISIONING MARKET, BY COMPONENT, 2018-2032 (USD BILLION)

TABLE 108 AFRICA ZERO-TOUCH PROVISIONING MARKET, BY DEVICE TYPE, 2018-2032 (USD BILLION)

TABLE 109 AFRICA ZERO-TOUCH PROVISIONING MARKET, BY NETWORK COMPLEXITY, 2018-2032 (USD BILLION)

TABLE 110 AFRICA ZERO-TOUCH PROVISIONING MARKET, BY ENTERPRISE SIZE, 2018-2032 (USD BILLION)

TABLE 111 AFRICA ZERO-TOUCH PROVISIONING MARKET, BY INDUSTRY, 2018-2032 (USD BILLION)

TABLE 112 LATIN AMERICA ZERO-TOUCH PROVISIONING MARKET, BY COMPONENT, 2018-2032 (USD BILLION)

TABLE 113 LATIN AMERICA ZERO-TOUCH PROVISIONING MARKET, BY DEVICE TYPE, 2018-2032 (USD BILLION)

TABLE 114 LATIN AMERICA ZERO-TOUCH PROVISIONING MARKET, BY NETWORK COMPLEXITY, 2018-2032 (USD BILLION)

TABLE 115 LATIN AMERICA ZERO-TOUCH PROVISIONING MARKET, BY ENTERPRISE SIZE, 2018-2032 (USD BILLION)

TABLE 116 LATIN AMERICA ZERO-TOUCH PROVISIONING MARKET, BY INDUSTRY, 2018-2032 (USD BILLION)

LIST OF FIGURES

FIGURE 1 RESEARCH PROCESS

FIGURE 2 MARKET STRUCTURE FOR THE GLOBAL ZERO-TOUCH PROVISIONING MARKET

FIGURE 3 MARKET DYNAMICS FOR THE GLOBAL ZERO-TOUCH PROVISIONING MARKET

FIGURE 4 GLOBAL ZERO-TOUCH PROVISIONING MARKET, SHARE (%), BY COMPONENT, 2022

FIGURE 5 GLOBAL ZERO-TOUCH PROVISIONING MARKET, SHARE (%), BY DEVICE TYPE, 2022

FIGURE 6 GLOBAL ZERO-TOUCH PROVISIONING MARKET, SHARE (%), BY NETWORK COMPLEXITY, 2022

FIGURE 7 GLOBAL ZERO-TOUCH PROVISIONING MARKET, SHARE (%), BY ENTERPRISE SIZE, 2022

FIGURE 8 GLOBAL ZERO-TOUCH PROVISIONING MARKET, SHARE (%), BY INDUSTRY, 2022

FIGURE 9 GLOBAL ZERO-TOUCH PROVISIONING MARKET, SHARE (%), BY REGION, 2022

FIGURE 10 NORTH AMERICA: ZERO-TOUCH PROVISIONING MARKET, SHARE (%), BY REGION, 2022

FIGURE 11 EUROPE: ZERO-TOUCH PROVISIONING MARKET, SHARE (%), BY REGION, 2022

FIGURE 12 ASIA-PACIFIC: ZERO-TOUCH PROVISIONING MARKET, SHARE (%), BY REGION, 2022

FIGURE 13 REST OF THE WORLD: ZERO-TOUCH PROVISIONING MARKET, SHARE (%), BY REGION, 2022

FIGURE 14 GLOBAL ZERO-TOUCH PROVISIONING MARKET: COMPANY SHARE ANALYSIS, 2022 (%)

FIGURE 15 CISCO SYSTEMS, INC.: FINANCIAL OVERVIEW SNAPSHOT

FIGURE 16 CISCO SYSTEMS, INC.: SWOT ANALYSIS

FIGURE 17 NOKIA CORPORATION: FINANCIAL OVERVIEW SNAPSHOT

FIGURE 18 NOKIA CORPORATION: SWOT ANALYSIS

FIGURE 19 TELEFONAKTIEBOLAGET LM ERICSSON: FINANCIAL OVERVIEW SNAPSHOT

FIGURE 20 TELEFONAKTIEBOLAGET LM ERICSSON: SWOT ANALYSIS

FIGURE 21 HUAWEI TECHNOLOGIES CO., LTD.: FINANCIAL OVERVIEW SNAPSHOT

FIGURE 22 HUAWEI TECHNOLOGIES CO., LTD.: SWOT ANALYSIS

FIGURE 23 ZTE CORPORATION.: FINANCIAL OVERVIEW SNAPSHOT

FIGURE 24 ZTE CORPORATION.: SWOT ANALYSIS

FIGURE 25 JUNIPER NETWORKS, INC.: FINANCIAL OVERVIEW SNAPSHOT

FIGURE 26 JUNIPER NETWORKS, INC.: SWOT ANALYSIS

FIGURE 27 HEWLETT PACKARD ENTERPRISE DEVELOPMENT LP: FINANCIAL OVERVIEW SNAPSHOT

FIGURE 28 HEWLETT PACKARD ENTERPRISE DEVELOPMENT LP: SWOT ANALYSIS

FIGURE 29 ARISTA NETWORKS, INC.: FINANCIAL OVERVIEW SNAPSHOT

FIGURE 30 ARISTA NETWORKS, INC.: SWOT ANALYSIS

FIGURE 31 EXTREME NETWORKS: FINANCIAL OVERVIEW SNAPSHOT

FIGURE 32 EXTREME NETWORKS: SWOT ANALYSIS

Purchase Option
Single User $ 4,950
Multiuser License $ 5,950
Enterprise User $ 7,250
Compare Licenses
Tailored for You
  • Dedicated Research on any specifics segment or region.
  • Focused Research on specific players in the market.
  • Custom Report based only on your requirements.
  • Flexibility to add or subtract any chapter in the study.
  • Historic data from 2014 and forecasts outlook till 2040.
  • Flexibility of providing data/insights in formats (PDF, PPT, Excel).
  • Provide cross segmentation in applicable scenario/markets.