Wireline Services Market Segmentation
Wireline Services Market By Service Type (USD Billion, 2025-2035)
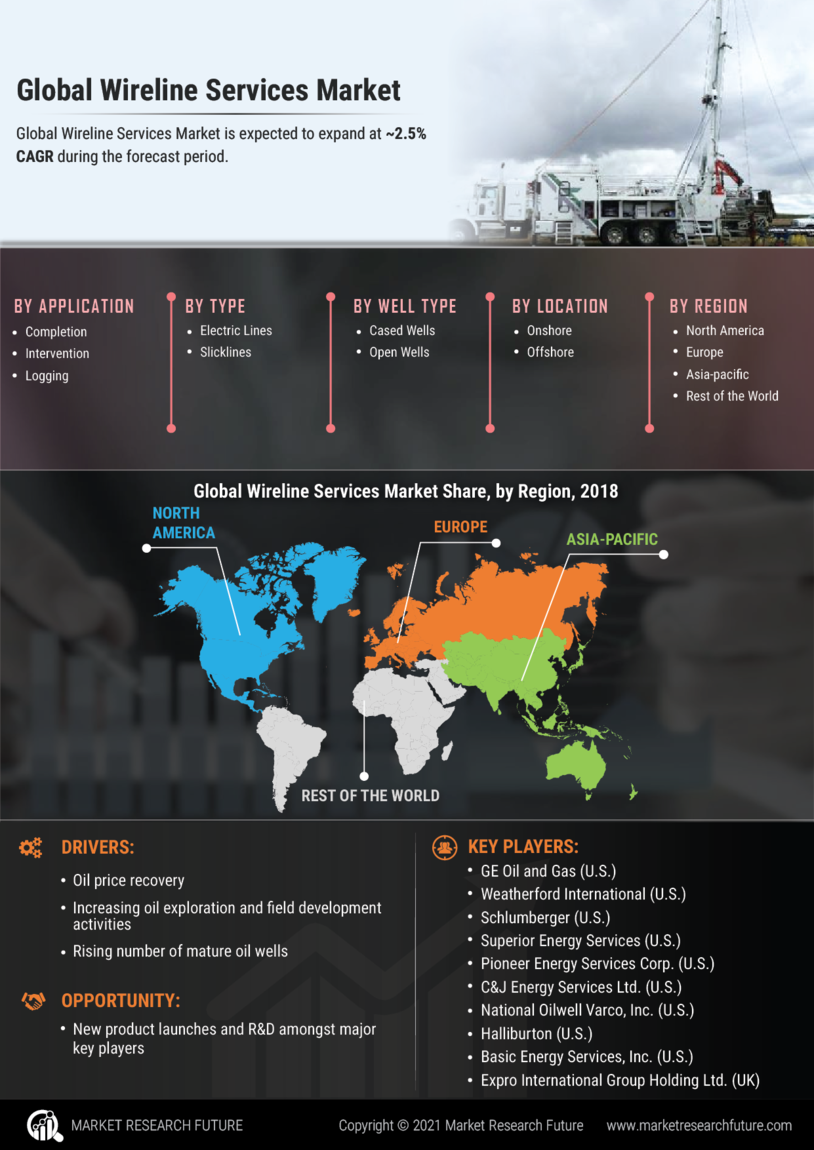
- Logging Services
- Completion Services
- Workover Services
- Fishing Services
Wireline Services Market By Application (USD Billion, 2025-2035)
- Onshore
- Offshore
Wireline Services Market By Well Type (USD Billion, 2025-2035)
- Vertical Wells
- Horizontal Wells
Wireline Services Market By Wireline Services Market (USD Billion, 2025-2035)
- Coiled Tubing
- Wireline Logging
- Cased Hole Logging