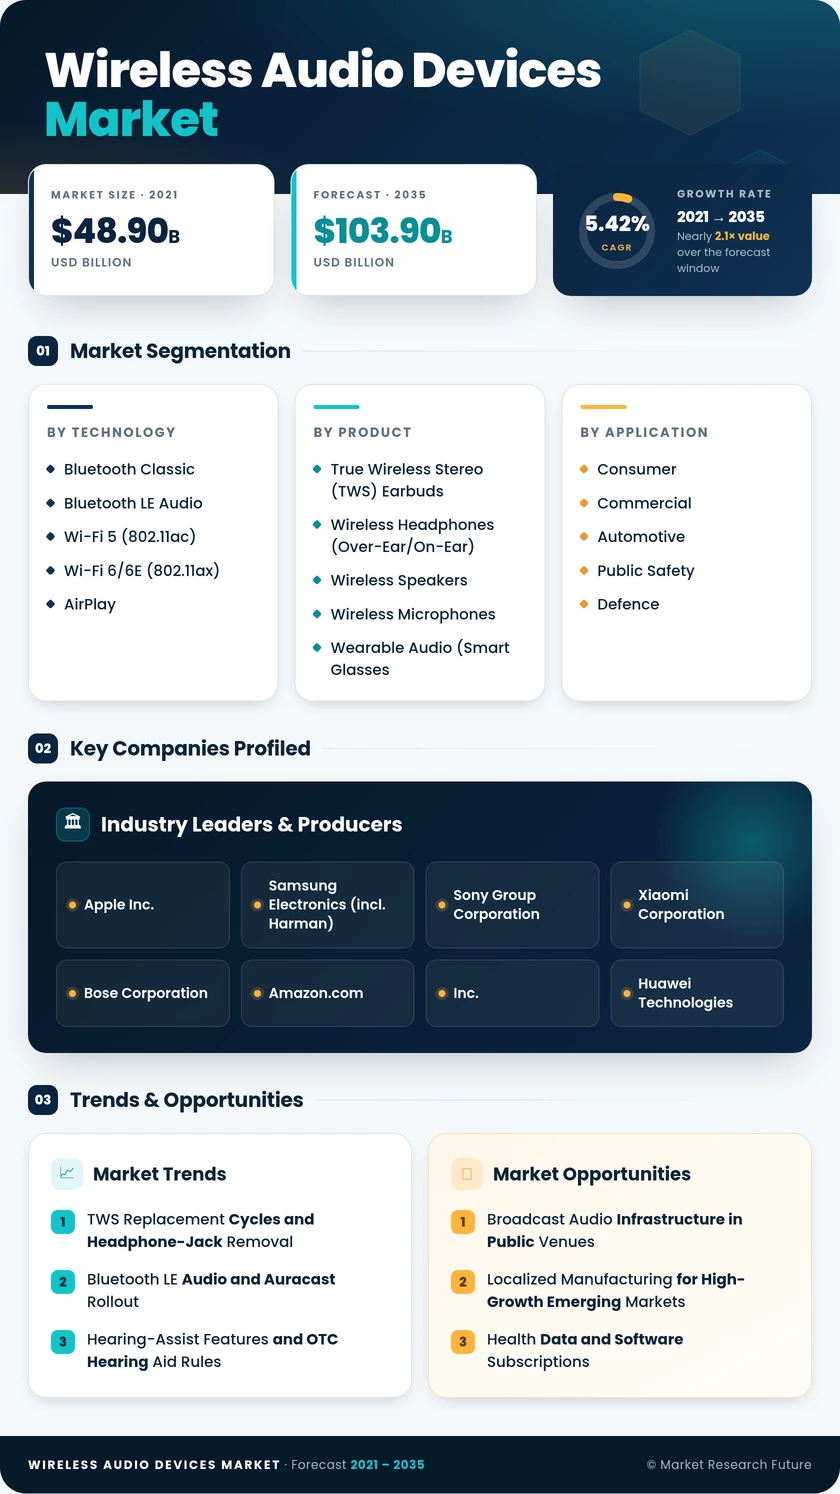
Wireless Audio Devices Market (2026 - 2035)

ID: MRFR/SEM/0318-CR 200 Pages Aarti Dhapte Last Updated: November 03, 2026
Wireless Audio Devices Market Size, Share and Research Report By Technology (Bluetooth Classic, Bluetooth LE Audio, Wi-Fi 5 (802.11ac), Wi-Fi 6/6E (802.11ax), AirPlay, RF/ZigBee, and Ultra-Wideband (UWB)), By Product (True Wireless Stereo (TWS) Earbuds, Wireless Headphones (Over-Ear/On-Ear), Wireless Speakers, Wireless Microphones, Wearable Audio (Smart Glasses, Hearables), and Others), By Application (Consumer, Commercial, Automotive, Public Safety and Defence, and Others), By Price Range (Premium (More than USD 250), Mid-range (USD 100–249), and Budget (Less than USD 100)), By Distribution Channel (Online and Offline) – Industry Forecast Till 2035
Wireless Audio Devices Market
Market Size
Forecast Period2026-2035
CAGR (2026-2035)5.42%
2025 Market SizeUSD 61.3 Billion
2035 Market SizeUSD 103.9 Billion
Key Players
Apple Inc.
Samsung Electronics
Sony Group Corporation
Xiaomi Corporation
Bose Corporation
Amazon.com, Inc.
Opportunities
  • Broadcast Audio Infrastructure in Public Venues
  • Localized Manufacturing for High-Growth Emerging Markets
  • Health Data and Software Subscriptions
  1. 1 Market Summary | |
  2. 2 Key Report Takeaways | |
    1. 2.1 By Technology | |
    2. 2.2 By Product | |
    3. 2.3 By Application | |
    4. 2.4 By Price Range | |
    5. 2.5 By Distribution Channel | |
    6. 2.6 By Region | |
  3. 3 Market Size and Forecast (2021–2035) | |
  4. 4 Driver Impact Analysis | |
    1. 4.1 TWS Replacement Cycles and Headphone-Jack Removal | |
    2. 4.2 Bluetooth LE Audio and Auracast Rollout | |
    3. 4.3 Hearing-Assist Features and OTC Hearing Aid Rules | |
    4. 4.4 Premium In-Vehicle Audio and Connected Cabins | |
    5. 4.5 Multi-Room Speakers on Wi-Fi 6/6E | |
    6. 4.6 Hybrid Work and Enterprise Conferencing | |
    7. 4.7 Rising Connectivity and Incomes in Emerging Economies | |
  5. 5 Restraints Impact Analysis | |
    1. 5.1 Battery Replaceability and E-Waste Regulation | |
    2. 5.2 Tariffs and Manufacturing Concentration | |
    3. 5.3 Counterfeit and Grey-Market Products | |
    4. 5.4 Spectrum Congestion and Interference | |
    5. 5.5 Safe-Listening Limits and Hearing-Damage Concerns | |
  6. 6 Opportunities | |
    1. 6.1 Broadcast Audio Infrastructure in Public Venues | |
    2. 6.2 Localized Manufacturing for High-Growth Emerging Markets | |
    3. 6.3 Health Data and Software Subscriptions | |
    4. 6.4 Repairable and Refurbished Product Lines | |
    5. 6.5 Over-the-Air Audio Upgrades in Vehicles | |
  7. 7 Regional Market Share and Country-Level Analysis | |
    1. 7.1 North America | | |
      1. 7.1.1 United States | | |
      2. 7.1.2 Canada | | |
      3. 7.1.3 Mexico | |
    2. 7.2 Europe | | |
      1. 7.2.1 Germany | | |
      2. 7.2.2 United Kingdom | | |
      3. 7.2.3 France | | |
      4. 7.2.4 Nordics | | |
      5. 7.2.5 Rest of Europe | |
    3. 7.3 South America | | |
      1. 7.3.1 Brazil | | |
      2. 7.3.2 Rest of South America | |
    4. 7.4 Asia-Pacific | | |
      1. 7.4.1 China | | |
      2. 7.4.2 Japan | | |
      3. 7.4.3 India | | |
      4. 7.4.4 South-East Asia | | |
      5. 7.4.5 Rest of Asia-Pacific | |
    5. 7.5 Middle East and Africa | | |
      1. 7.5.1 Middle East | | |
      2. 7.5.2 Gulf Cooperation Council Countries | | |
      3. 7.5.3 Turkey | | |
      4. 7.5.4 Rest of Middle East | | |
      5. 7.5.5 Africa | | |
      6. 7.5.6 South Africa | | |
      7. 7.5.7 Rest of Africa | |
  8. 8 Future Outlook (2026–2035) | |
    1. 8.1 On-Device AI and Adaptive Audio | |
    2. 8.2 Hearables as Health Platforms | |
    3. 8.3 Ecosystem Lock-In Versus Open Standards | |
    4. 8.4 Circularity and Sustainable Design | |
  9. 9 Segmentation Analysis | |
    1. 9.1 By Technology | | |
      1. 9.1.1 Bluetooth Classic | | |
      2. 9.1.2 Bluetooth LE Audio | | |
      3. 9.1.3 Wi-Fi 5 (802.11ac) | | |
      4. 9.1.4 Wi-Fi 6/6E (802.11ax) | | |
      5. 9.1.5 AirPlay | | |
      6. 9.1.6 RF/ZigBee | | |
      7. 9.1.7 Ultra-Wideband (UWB) | |
    2. 9.2 By Product | | |
      1. 9.2.1 True Wireless Stereo (TWS) Earbuds | | |
      2. 9.2.2 Wireless Headphones (Over-Ear/On-Ear) | | |
      3. 9.2.3 Wireless Speakers | | | |
        1. 9.2.3.1 Smart Speakers | | | |
        2. 9.2.3.2 Portable Speakers | | | |
        3. 9.2.3.3 Sound Bars | | |
      4. 9.2.4 Wireless Microphones | | |
      5. 9.2.5 Wearable Audio (Smart Glasses, Hearables) | | |
      6. 9.2.6 Others | |
    3. 9.3 By Application | | |
      1. 9.3.1 Consumer | | | |
        1. 9.3.1.1 Home Entertainment | | | |
        2. 9.3.1.2 Gaming | | | |
        3. 9.3.1.3 Fitness and Sports | | |
      2. 9.3.2 Commercial | | | |
        1. 9.3.2.1 Corporate and Education | | | |
        2. 9.3.2.2 Hospitality | | | |
        3. 9.3.2.3 Events and Venues | | |
      3. 9.3.3 Automotive | | | |
        1. 9.3.3.1 Passenger Vehicles | | | |
        2. 9.3.3.2 Commercial Vehicles | | |
      4. 9.3.4 Public Safety and Defence | | |
      5. 9.3.5 Others | |
    4. 9.4 By Price Range | | |
      1. 9.4.1 Premium (More than USD 250) | | |
      2. 9.4.2 Mid-range (USD 100-249) | | |
      3. 9.4.3 Budget (Less than USD 100) | |
    5. 9.5 By Distribution Channel | | |
      1. 9.5.1 Online | | | |
        1. 9.5.1.1 Direct Brand E-Stores | | | |
        2. 9.5.1.2 E-commerce Marketplaces | | |
      2. 9.5.2 Offline | | | |
        1. 9.5.2.1 Consumer-Electronics Retail | | | |
        2. 9.5.2.2 Hypermarkets and Mass Merchandisers | | | |
        3. 9.5.2.3 Specialty Audio Stores | | | |
        4. 9.5.2.4 Automotive Aftermarket | |
  10. 10 Competitive Landscape | |
    1. 10.1 Market Concentration Analysis | |
    2. 10.2 Competitive Benchmarking Table | |
    3. 10.3 Company Profiles | | |
      1. 10.3.1 Apple Inc. | | |
      2. 10.3.2 Samsung Electronics (incl. Harman) | | |
      3. 10.3.3 Sony Group Corporation | | |
      4. 10.3.4 Xiaomi Corporation | | |
      5. 10.3.5 Bose Corporation | | |
      6. 10.3.6 Amazon.com, Inc. | | |
      7. 10.3.7 Huawei Technologies | | |
      8. 10.3.8 Sonos, Inc. | | |
      9. 10.3.9 GN Store Nord (Jabra) | | |
      10. 10.3.10 Sonova (Sennheiser Consumer) | | |
      11. 10.3.11 Shure Incorporated | | |
      12. 10.3.12 Bang & Olufsen | |
  11. 11 Recent News & Developments | |
  12. 12 Report Scope and Methodology | |
  13. 13 Detailed Sources and Citations | |
  14. 14 Frequently Asked Questions (FAQs) | | LIST OF TABLES | |
  15. TABLE 1 Global Wireless Audio Devices Market Summary, 2025–2035 | |
  16. TABLE 2 Global Market Size & Forecast, by Revenue (USD Billion), 2021–2035 | |
  17. TABLE 3 Driver Impact Analysis on CAGR, 2026–2035 | |
  18. TABLE 4 Restraints Impact Analysis on CAGR, 2026–2035 | |
  19. TABLE 5 Regional Market Summary, 2025 | |
  20. TABLE 6 North America Market, by Country, 2025 | |
  21. TABLE 7 Europe Market, by Country, 2025 | |
  22. TABLE 8 South America Market, by Country, 2025 | |
  23. TABLE 9 Asia-Pacific Market, by Country, 2025 | |
  24. TABLE 10 Middle East and Africa Market, by Country, 2025 | |
  25. TABLE 11 Global Market, by Technology, 2025 | |
  26. TABLE 12 Global Market, by Product, 2025 | |
  27. TABLE 13 Global Market, by Application, 2025 | |
  28. TABLE 14 Global Market, by Price Range, 2025 | |
  29. TABLE 15 Global Market, by Distribution Channel, 2025 | |
  30. TABLE 16 Competitive Benchmarking Table, 2025 | |
  31. TABLE 17 Report Scope and Methodology | |
  32. TABLE 18 Detailed Sources and Citations | | LIST OF FIGURES | |
  33. FIGURE 1 Market Dynamics Overview (Drivers, Restraints, Opportunities) | |
  34. FIGURE 2 Industry Value Chain Analysis | |
  35. FIGURE 3 Porter's Five Forces Analysis | |
  36. FIGURE 4 Global Market Size Trend, 2021–2035 (USD Billion) | |
  37. FIGURE 5 Market Share by Technology, 2025 | |
  38. FIGURE 6 Market Share by Product, 2025 | |
  39. FIGURE 7 Market Share by Application, 2025 | |
  40. FIGURE 8 Market Share by Price Range, 2025 | |
  41. FIGURE 9 Market Share by Distribution Channel, 2025 | |
  42. FIGURE 10 Regional Market Share, 2025 | |
  43. FIGURE 11 Competitive Landscape Positioning Matrix, 2025

Segmentation Quick Reference

DimensionSub-SegmentsDominant SegmentFastest Growing Segment
By TechnologyBluetooth Classic; Bluetooth LE Audio; Wi-Fi 5 (802.11ac); Wi-Fi 6/6E (802.11ax); AirPlay; RF/ZigBee; Ultra-Wideband (UWB)Bluetooth Classic (79.6% share)Bluetooth LE Audio (9.9% CAGR)
By ProductTrue Wireless Stereo (TWS) Earbuds; Wireless Headphones (Over-Ear/On-Ear); Wireless Speakers; Wireless Microphones; Wearable Audio (Smart Glasses, Hearables); OthersTrue Wireless Stereo (TWS) Earbuds (44.1% share)Wearable Audio (Smart Glasses, Hearables) (7.3% CAGR)
By ApplicationConsumer; Commercial; Automotive; Public Safety and Defence; OthersConsumer (68.8% share)Automotive (8.5% CAGR)
By Price RangePremium (More than USD 250); Mid-range (USD 100-249); Budget (Less than USD 100)Mid-range (USD 100-249) (52.4% share)Premium (More than USD 250) (6.4% CAGR)
By Distribution ChannelOnline; OfflineOnline (66.5% share)Direct Brand E-Stores (6.3% CAGR)
By RegionNorth America; Europe; South America; Asia-Pacific; Middle East and AfricaAsia-Pacific (38.6% share)Middle East and Africa (7.4% CAGR)

Market Segmentation Overview

By Technology

Sub-SegmentKey Trend
Bluetooth ClassicDual-mode chipsets extend its lifespan
Bluetooth LE AudioLC3 codec and broadcast streaming go mainstream
Wi-Fi 5 (802.11ac)Large installed base of multi-room speakers
Wi-Fi 6/6E (802.11ax)6 GHz channels support high-resolution playback
AirPlayTied to Apple device ownership
RF/ZigBeeLow-latency gaming and pro links
Ultra-Wideband (UWB)Positional audio in vehicles

Bluetooth Classic leads because nearly every phone and car supports it, holding a 79.6% share. Bluetooth LE Audio grows fastest at 9.9% CAGR as LC3 and Auracast arrive on Android and iOS. Wi-Fi 6/6E (802.11ax) gains ground in premium home speakers that need more bandwidth than Bluetooth provides.

By Product

Sub-SegmentKey Trend
True Wireless Stereo (TWS) EarbudsAnnual battery and ANC upgrades
Wireless Headphones (Over-Ear/On-Ear)Premium refuge for travel and focus
Wireless SpeakersSmart Speakers, Portable Speakers and Sound Bars evolve into home hubs
Wireless MicrophonesCreator and conferencing demand
Wearable Audio (Smart Glasses, Hearables)Health sensing and AR integration
OthersSleep, swim and bone-conduction niches

True Wireless Stereo (TWS) Earbuds dominate with a 44.1% share, driven by smartphone bundling and short replacement cycles. Wearable Audio (Smart Glasses, Hearables) grows fastest at 7.3% CAGR as open-ear glasses and health-tracking hearables reach mass retail. Wireless Speakers remain a large value pool as soundbars and smart speakers anchor home ecosystems.

By Application

Sub-SegmentKey Trend
ConsumerStreaming, gaming and fitness audio
CommercialHybrid meetings and flexible venue audio
AutomotiveBranded multi-zone in-cabin sound
Public Safety and DefenceEncrypted, extended-range headsets
OthersHealthcare and industrial communication

Consumer applications lead with a 68.8% share because personal listening remains the core use. Automotive grows fastest at 8.5% CAGR as automakers sell branded sound and OTA audio upgrades in Passenger Vehicles. Commercial demand holds firm as offices and venues standardize on wireless conferencing and reconfigurable audio.

By Price Range

Sub-SegmentKey Trend
Premium (More than USD 250)AI tuning, head tracking and hearing assist
Mid-range (USD 100-249)Flagship features trickle down
Budget (Less than USD 100)Volume driver in emerging markets

Mid-range (USD 100-249) devices hold a 52.4% share because ANC and multipoint pairing now come standard at that price. Premium (More than USD 250) products grow fastest at 6.4% CAGR, as buyers pay for AI-driven tuning and hearing-assist features. Budget (Less than USD 100) models keep unit volumes high but face margin pressure.

By Distribution Channel

Sub-SegmentKey Trend
OnlineDirect Brand E-Stores and E-commerce Marketplaces gain share
OfflineDemos and expert fitting sustain premium sales

Online channels lead with a 66.5% share, as reviews and fast delivery win buyers across price tiers. Within Online, Direct Brand E-Stores grow fastest at 6.3% CAGR by bundling warranties, firmware services and trade-ins. Offline retail keeps a 33.5% share through hands-on demos at Consumer-Electronics Retail and Specialty Audio Stores.


Download PDF ×

We do not share your information with anyone. However, we may send you emails based on your report interest from time to time. You may contact us at any time to opt-out.