Water Cut Monitors Market Segmentation
Water Cut Monitors Market By Sector (USD Billion, 2025-2035)
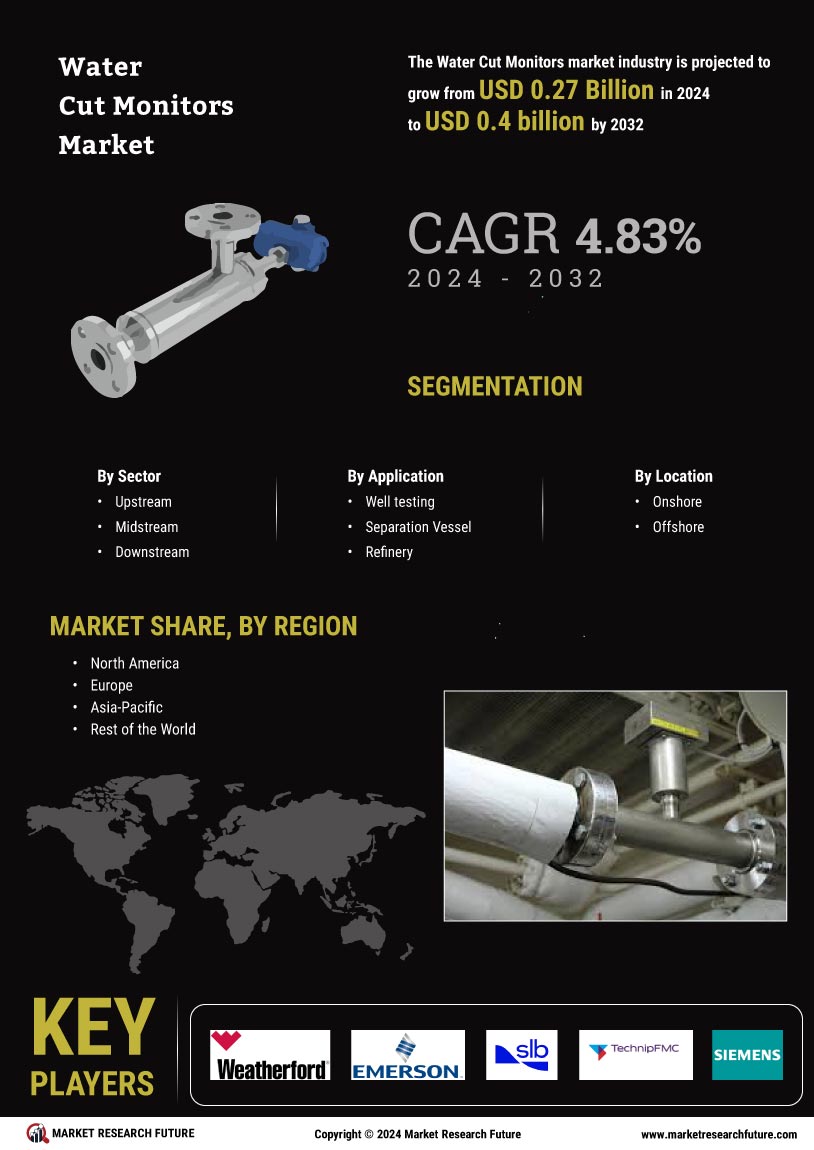
- Upstream
- Midstream
- Downstream
Water Cut Monitors Market By Application (USD Billion, 2025-2035)
- Well Testing
- Separation Vessel
- Refinery
- Others
Water Cut Monitors Market By Location (USD Billion, 2025-2035)
- Onshore
- Offshore