Segmentation Quick Reference
| Dimension | Sub-Segments | Dominant Segment | Fastest Growing Segment |
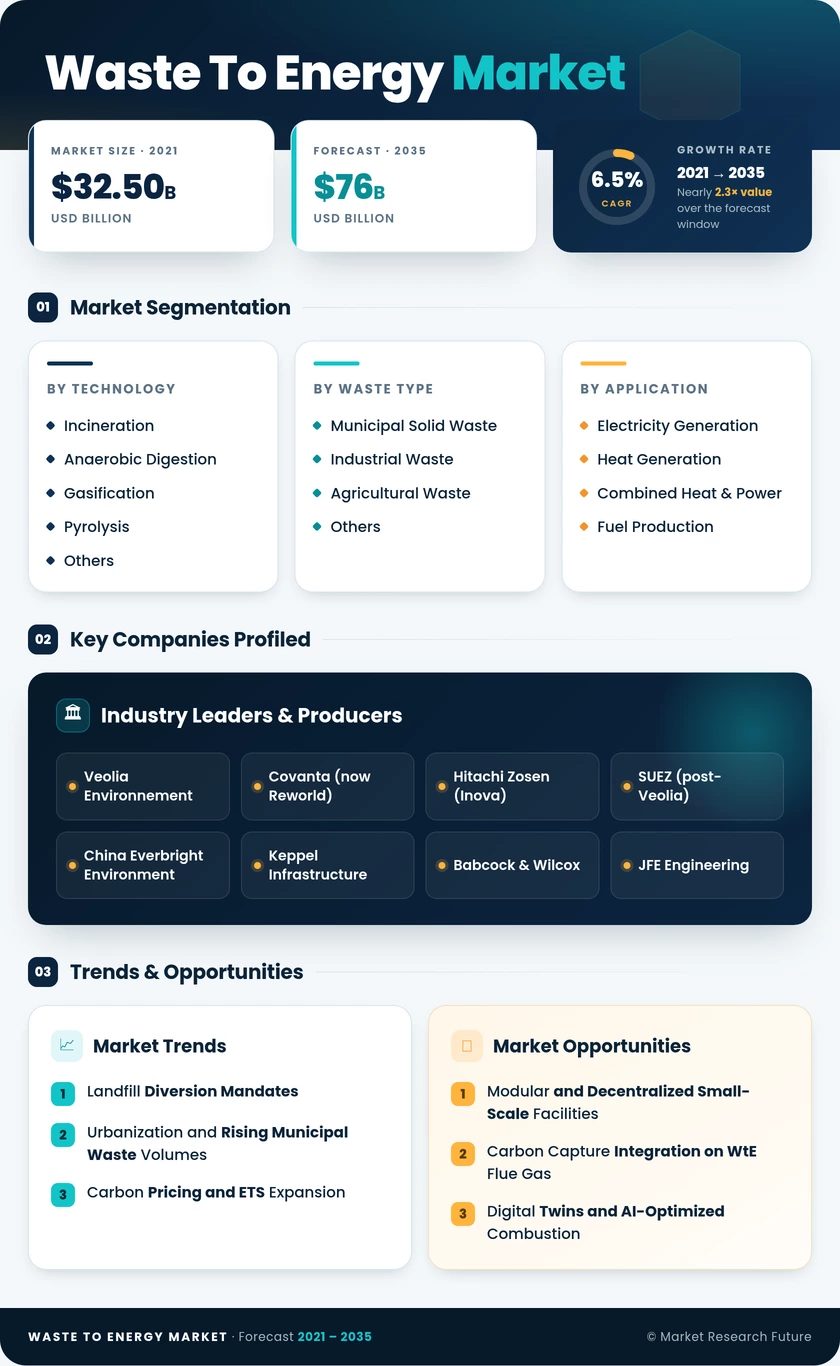
| By Waste to Energy Market | Incineration, Anaerobic Digestion, Gasification, Pyrolysis, Others | Incineration (~42% share) | Gasification (8.9% CAGR) |
| By Waste Type | Municipal Solid Waste, Industrial Waste, Agricultural Waste, Others | Municipal Solid Waste (~48% share) | Industrial Waste (7.3% CAGR) |
| By Application | Electricity Generation, Heat Generation, Combined Heat & Power, Fuel Production | Electricity Generation (~55% share) | Heat Generation (6.2% CAGR) |
Market Segmentation Overview
By Waste to Energy Market
| Sub-Segment | Key Trend |
| Incineration (Mass Burn) | Retrofit-driven modernization in Europe; fluidized-bed variants gaining ground in Asia |
| Anaerobic Digestion | Expansion in agricultural economies; co-digestion with sewage sludge improving yields |
| Gasification | Syngas-to-power and syngas-to-chemicals pathways attracting venture capital |
| Pyrolysis | Plastic-to-fuel conversion gaining regulatory support in the UK and Japan |
| Others (Plasma Arc, RDF) | Plasma arc confined to hazardous waste niches; RDF co-firing in cement kilns expanding |
Waste to Energy Market selection in the Waste To Energy Market is increasingly driven by emission-limit stringency and feedstock composition rather than capital cost alone. Gasification and pyrolysis technologies are gaining ground in jurisdictions that impose near-zero dioxin limits, while incineration maintains dominance where waste volumes justify large centralized capacity and regulatory frameworks are well-established.
By Waste Type
| Sub-Segment | Key Trend |
| Municipal Solid Waste | Volume growth outpacing recycling infrastructure in emerging economies |
| Industrial Waste | Extended producer responsibility legislation expanding treatment mandates |
| Agricultural Waste | Biogas incentives in India and the EU driving farm-scale digestion |
| Others (Medical, Hazardous, C&D) | Pandemic-era medical waste volumes normalizing; C&D waste rising with urbanization |
Feedstock dynamics shape the competitive economics of every Waste To Energy Market project. Municipal solid waste remains the highest-volume category, but industrial and agricultural streams offer higher and more predictable calorific values, reducing operational variability and improving energy-output guarantees for project lenders.
By Application
| Sub-Segment | Key Trend |
| Electricity Generation | Grid parity improving with rising wholesale power prices |
| Heat Generation | District heating networks in Scandinavia and Baltic states absorbing WtE thermal output |
| Combined Heat & Power | EU R1 formula incentivizing CHP configurations for permit eligibility |
| Fuel Production | Hydrogen and synthetic fuel pathways entering pilot-to-commercial transition |
Application mix in the Waste To Energy Market varies sharply by region. Northern European operators derive the majority of revenue from heat sales into district networks, while facilities in the United States and Asia depend almost entirely on electricity offtake agreements. Combined heat and power configurations are set to gain share as regulators increasingly link treatment permits to minimum energy-efficiency thresholds.