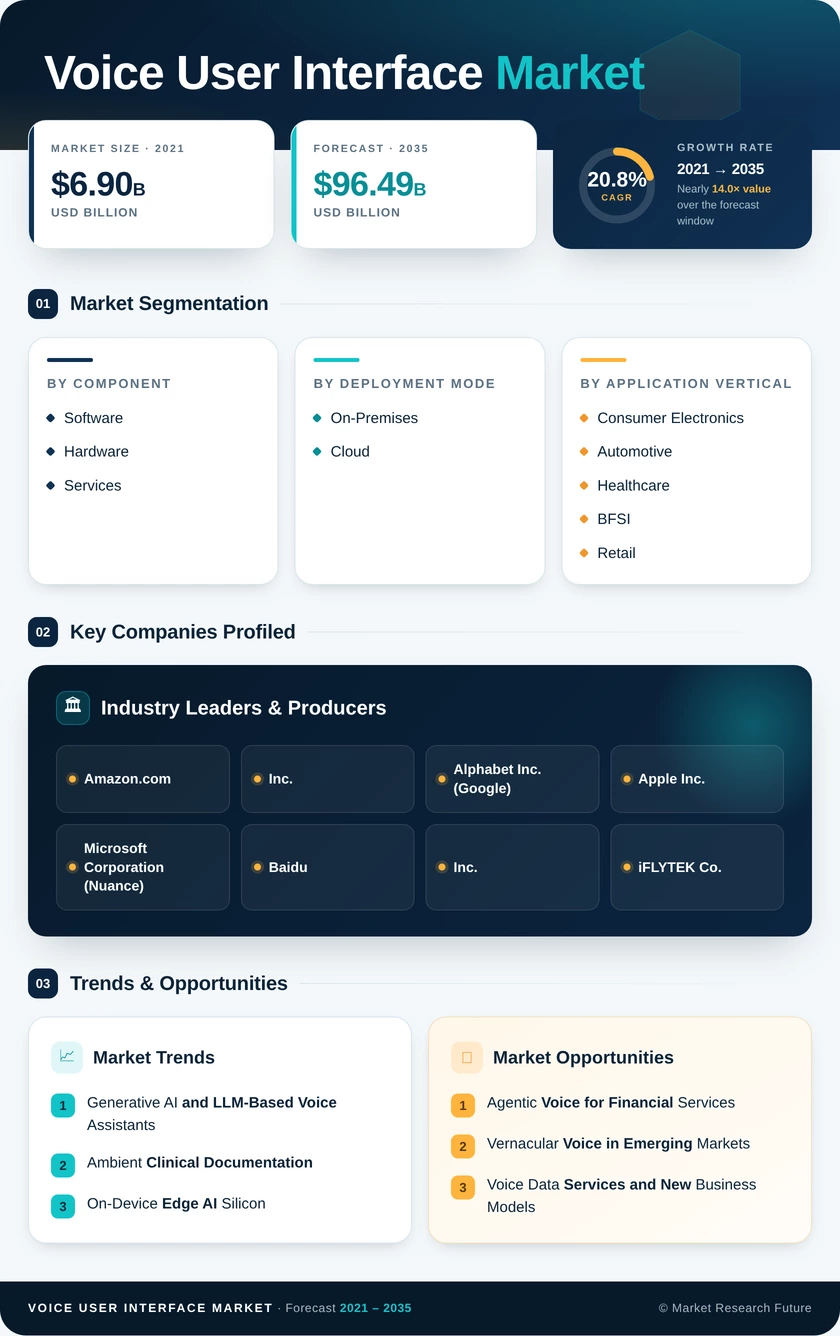
Voice User Interface Market (2026 - 2035)

ID: MRFR/ICT/30955-HCR 100 Pages Aarti Dhapte Last Updated: October 22, 2026
Voice User Interface Market Size, Share and Research Report By Component (Software, Hardware, and Services), By Deployment Mode (On-Premises, and Cloud), By Application Vertical (Consumer Electronics, Automotive, Healthcare, BFSI, Retail and E-Commerce, Education, and Others), By Technology Stack (Edge AI Processing, Cloud-Based Processing, and Hybrid Processing) And By Region (North America, Europe, Asia-Pacific, And Rest Of The World) –Industry Forecast Till 2035
Voice User Interface Market
Market Size
Forecast Period2026-2035
CAGR (2026-2035)20.8%
2025 Market SizeUSD 14.40 Billion
2035 Market SizeUSD 96.49 Billion
Key Players
Amazon.com, Inc.
Alphabet Inc.
Apple Inc.
Microsoft Corporation
Baidu, Inc.
iFLYTEK Co., Ltd.
Opportunities
  • Agentic Voice for Financial Services
  • Vernacular Voice in Emerging Markets
  • Voice Data Services and New Business Models
  1. 1 Market Summary | |
  2. 2 Key Report Takeaways | |
    1. 2.1 By Component | |
    2. 2.2 By Deployment Mode | |
    3. 2.3 By Application Vertical | |
    4. 2.4 By Technology Stack | |
    5. 2.5 By Region | |
  3. 3 Market Size and Forecast (2021–2035) | |
    1. 3.1 Historical Market Size (2021–2025) | |
    2. 3.2 Forecast Market Size (2026–2035) | |
    3. 3.3 Year-over-Year Growth Analysis | |
  4. 4 Driver Impact Analysis | |
    1. 4.1 Generative AI and LLM-Based Voice Assistants | |
    2. 4.2 Ambient Clinical Documentation | |
    3. 4.3 In-Vehicle Voice and Driver-Distraction Rules | |
    4. 4.4 On-Device Edge AI Silicon | |
    5. 4.5 Vernacular-Language Digital Inclusion | |
    6. 4.6 Accessibility Mandates and Ageing Populations | |
    7. 4.7 Voice Ordering in Quick-Service Restaurants | |
  5. 5 Restraints Impact Analysis | |
    1. 5.1 Biometric Privacy and Data-Localization Rules | |
    2. 5.2 Accuracy Gaps Across Accents and Noisy Settings | |
    3. 5.3 Voice Cloning Fraud and Deepfake Risk | |
    4. 5.4 High Inference and Integration Costs | |
    5. 5.5 Consumer Assistant Monetization Fatigue | |
  6. 6 Opportunities | |
    1. 6.1 Agentic Voice for Financial Services | |
    2. 6.2 Vernacular Voice in Emerging Markets | |
    3. 6.3 Voice Data Services and New Business Models | |
    4. 6.4 Sovereign and On-Premises Deployments | |
    5. 6.5 Accessibility-Led Product Design | |
  7. 7 Regional Market Share and Country-Level Analysis | |
    1. 7.1 North America | | |
      1. 7.1.1 United States | | |
      2. 7.1.2 Canada | | |
      3. 7.1.3 Mexico | |
    2. 7.2 Europe | | |
      1. 7.2.1 Germany | | |
      2. 7.2.2 UK | | |
      3. 7.2.3 France | | |
      4. 7.2.4 Italy | | |
      5. 7.2.5 Spain | | |
      6. 7.2.6 Nordic Countries | | |
      7. 7.2.7 Russia | | |
      8. 7.2.8 Rest of Europe | |
    3. 7.3 Asia-Pacific | | |
      1. 7.3.1 China | | |
      2. 7.3.2 India | | |
      3. 7.3.3 Japan | | |
      4. 7.3.4 South Korea | | |
      5. 7.3.5 ASEAN | | |
      6. 7.3.6 Rest of Asia-Pacific | |
    4. 7.4 South America | | |
      1. 7.4.1 Brazil | | |
      2. 7.4.2 Argentina | | |
      3. 7.4.3 Rest of South America | |
    5. 7.5 Middle East & Africa | | |
      1. 7.5.1 Saudi Arabia | | |
      2. 7.5.2 UAE | | |
      3. 7.5.3 South Africa | | |
      4. 7.5.4 Egypt | | |
      5. 7.5.5 Rest of MEA | |
  8. 8 Future Outlook (2026–2035) | |
    1. 8.1 From Assistants to Voice Agents | |
    2. 8.2 Hybrid Architectures Become Standard | |
    3. 8.3 Governance and Trust Infrastructure | |
    4. 8.4 The Next Billion Voice Users | |
  9. 9 Segmentation Analysis | |
    1. 9.1 By Component | | |
      1. 9.1.1 Software | | |
      2. 9.1.2 Hardware | | |
      3. 9.1.3 Services | |
    2. 9.2 By Deployment Mode | | |
      1. 9.2.1 On-Premises | | |
      2. 9.2.2 Cloud | |
    3. 9.3 By Application Vertical | | |
      1. 9.3.1 Consumer Electronics | | |
      2. 9.3.2 Automotive | | |
      3. 9.3.3 Healthcare | | |
      4. 9.3.4 BFSI | | |
      5. 9.3.5 Retail and E-Commerce | | |
      6. 9.3.6 Education | | |
      7. 9.3.7 Others | |
    4. 9.4 By Technology Stack | | |
      1. 9.4.1 Edge AI Processing | | |
      2. 9.4.2 Cloud-Based Processing | | |
      3. 9.4.3 Hybrid Processing | |
  10. 10 Competitive Landscape | |
    1. 10.1 Market Concentration Analysis | |
    2. 10.2 Competitive Benchmarking Matrix | |
  11. 11 Recent News & Developments | |
  12. 12 Report Scope and Methodology | |
  13. 13 Detailed Sources and Citations | |
  14. 14 Frequently Asked Questions (FAQs) | | LIST OF TABLES | |
  15. TABLE 1 Global Market Size & Forecast, by Revenue (USD Billion), 2021–2035 | |
  16. TABLE 2 Year-over-Year Growth Analysis, 2021–2035 | |
  17. TABLE 3 Driver Impact Analysis | |
  18. TABLE 4 Restraints Impact Analysis | |
  19. TABLE 5 Regional Market Summary, 2025 | |
  20. TABLE 6 North America Market, by Country, 2025 | |
  21. TABLE 7 Europe Market, by Country, 2025 | |
  22. TABLE 8 Asia-Pacific Market, by Country, 2025 | |
  23. TABLE 9 South America Market, by Country, 2025 | |
  24. TABLE 10 Middle East & Africa Market, by Country, 2025 | |
  25. TABLE 11 Market Segmentation, by Component, 2025 | |
  26. TABLE 12 Market Segmentation, by Deployment Mode, 2025 | |
  27. TABLE 13 Market Segmentation, by Application Vertical, 2025 | |
  28. TABLE 14 Market Segmentation, by Technology Stack, 2025 | |
  29. TABLE 15 Competitive Benchmarking Matrix | |
  30. TABLE 16 Report Scope and Methodology | |
  31. TABLE 17 Detailed Sources and Citations | | LIST OF FIGURES | |
  32. FIGURE 1 Market Dynamics Overview (Drivers, Restraints, Opportunities) | |
  33. FIGURE 2 Value Chain Analysis | |
  34. FIGURE 3 Porter's Five Forces Analysis | |
  35. FIGURE 4 Global Market Size Trend, 2021–2035 (USD Billion) | |
  36. FIGURE 5 Market Share, by Component, 2025 | |
  37. FIGURE 6 Market Share, by Deployment Mode, 2025 | |
  38. FIGURE 7 Market Share, by Application Vertical, 2025 | |
  39. FIGURE 8 Market Share, by Technology Stack, 2025 | |
  40. FIGURE 9 Regional Market Share, 2025 | |
  41. FIGURE 10 Competitive Landscape Positioning Map

Segmentation Quick Reference

DimensionSub-SegmentsDominant SegmentFastest Growing Segment
By ComponentSoftware, Hardware, ServicesSoftware (53.2% share)Services (21.6% CAGR)
By Deployment ModeOn-Premises, CloudCloud (58.8% share)Cloud (faster-growing of the two modes)
By Application VerticalConsumer Electronics, Automotive, Healthcare, BFSI, Retail and E-Commerce, Education, OthersConsumer Electronics (33.6% share)Healthcare (24.1% CAGR)
By Technology StackEdge AI Processing, Cloud-Based Processing, Hybrid ProcessingEdge AI Processing (40.8% share)Edge AI Processing (paces stack growth)
By RegionNorth America, Europe, Asia-Pacific, South America, Middle East & AfricaNorth America (38.6% share)Asia-Pacific (24.6% CAGR)

Market Segmentation Overview

By Component

Sub-SegmentKey Trend
SoftwareShift from recognition licensing to generative assistant platforms
HardwareFar-field microphone arrays and NPUs in mainstream devices
ServicesRecurring retraining and vertical integration contracts

Software leads the component mix because assistant platforms and recognition APIs monetize every interaction across consumer and enterprise channels. Services grow fastest, since hospital, bank, and automaker deployments need custom vocabularies, accent tuning, and back-end integration that licensed software alone cannot deliver. Hardware keeps a stable role as microphone arrays and neural processors determine how well devices capture speech in noisy settings.

By Deployment Mode

Sub-SegmentKey Trend
On-PremisesSovereign installations for hospitals and public agencies
CloudGPU pooling lowers per-minute inference cost

Cloud leads deployment and remains the faster-growing mode because generative voice models depend on large shared GPU pools that few buyers can operate themselves. On-Premises still expands steadily where PIPL and DPDP Act rules block voiceprints from leaving national borders. Vendors serving regulated buyers increasingly offer both options under one product line.

By Application Vertical

Sub-SegmentKey Trend
Consumer ElectronicsGenerative assistant upgrades across phones and speakers
AutomotiveLLM-based in-cabin assistants replace touch menus
HealthcareAmbient documentation reduces clinician workload
BFSIVoice agents automate servicing; biometrics under review
Retail and E-CommerceDrive-through voice ordering scales
EducationPronunciation coaching and accessible learning
OthersHospitality, telecom, and public-service voice channels

Consumer Electronics leads on the sheer size of the phone and smart-speaker installed base. Healthcare grows fastest because ambient documentation saves measurable clinician time and earns multi-year contracts, while Automotive follows as cockpit redesigns route secondary controls through voice. BFSI and Retail and E-Commerce add steady demand through service automation and restaurant ordering.

By Technology Stack

Sub-SegmentKey Trend
Edge AI ProcessingOn-device models for latency and privacy
Cloud-Based ProcessingLarge multimodal models for complex reasoning
Hybrid ProcessingRouting simple commands locally, complex ones to the cloud

Edge AI Processing leads the technology stack and also paces its growth, as automotive and mobile chips now run capable speech models without a network connection. Cloud-Based Processing remains necessary for heavy multimodal reasoning that exceeds device memory. Hybrid Processing expands quickly because it cuts cloud costs while keeping access to advanced cloud models when needed.


Download PDF ×

We do not share your information with anyone. However, we may send you emails based on your report interest from time to time. You may contact us at any time to opt-out.