Virtual Retinal Display Market Segmentation
Virtual Retinal Display Market By Component (USD Billion, 2025-2035)
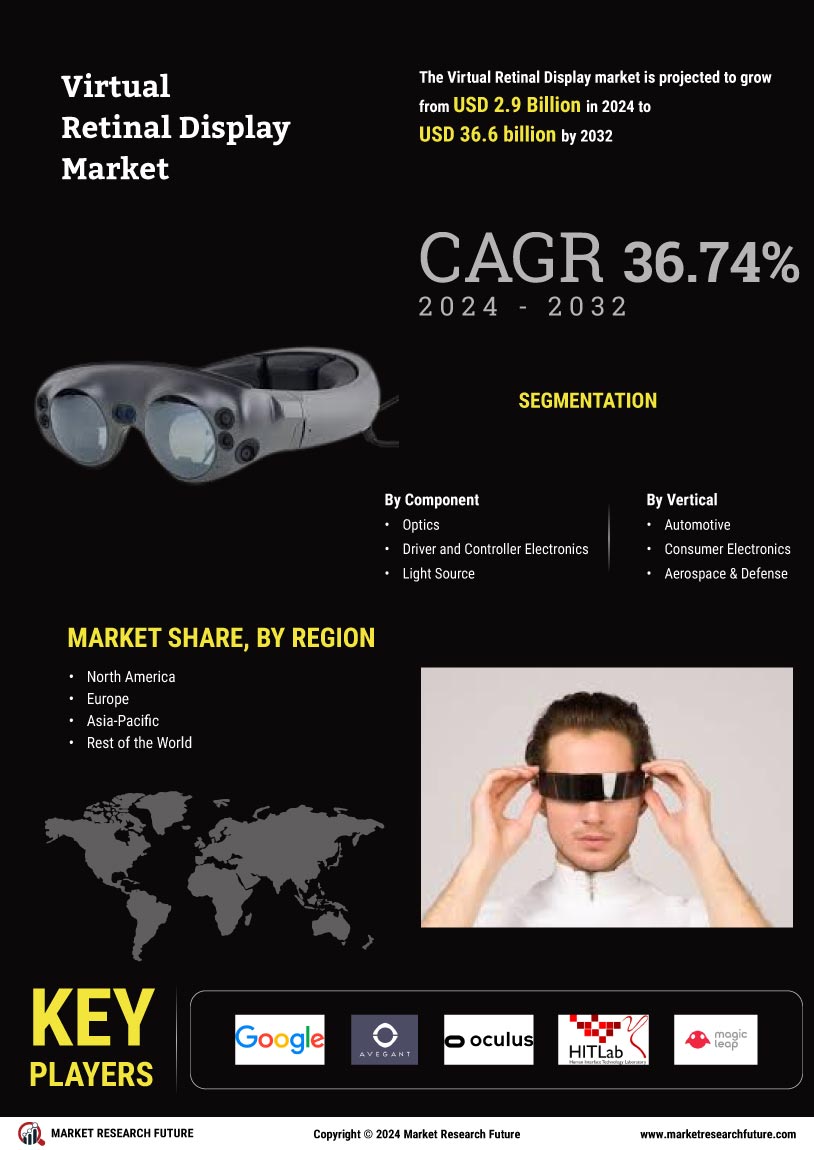
- Optics
- Driver and Controller Electronics
- Light Source
- Others
Virtual Retinal Display Market By Vertical (USD Billion, 2025-2035)
- Automotive
- Consumer Electronics
- Aerospace & Defense
- Healthcare
- Others