Viral Vectors & Plasmid DNA Manufacturing Market (2026 - 2035)

ID: MRFR/HC/9195-HCR 200 Pages Rahul Gotadki Last Updated: September 15, 2026
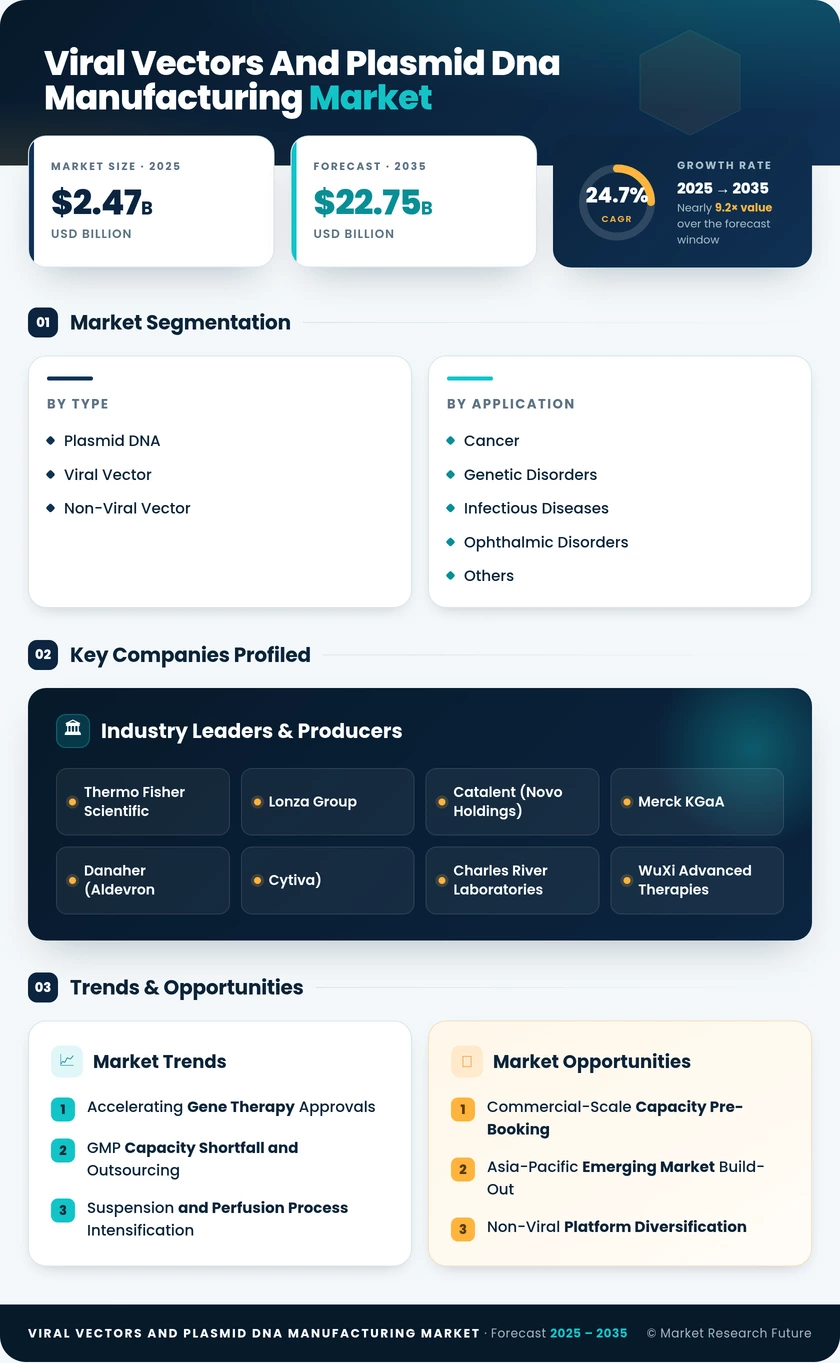
Viral Vectors and Plasmid DNA Manufacturing Market Research Report: Size, Share, Trend Analysis By Applications (Gene Therapy, Vaccine Development, Transgenic Research, Cell and Gene Editing), By Types (Viral Vectors, Plasmid DNA, RNA-based Vectors), By Technology (Viral Transduction, Electroporation, Microinjection, Liposomal Delivery), By End Use (Pharmaceutical Companies, Biotechnology Firms, Research Institutions) and By Regional (North America, Europe, South America, Asia Pacific, Middle East and Africa) - Growth Outlook & Industry Forecast 2025 To 2035
Viral Vectors & Plasmid DNA Manufacturing Market
Market Size
Forecast Period2026-2035
CAGR (2026-2035)24.7%
2025 Market SizeUSD 2.47 Billion
2035 Market SizeUSD 22.75 Billion
Key Players
Thermo Fisher Scientific
Lonza Group
Catalent
Merck KGaA
Danaher (Aldevron
Cytiva)
Opportunities
  • Commercial-Scale Capacity Pre-Booking
  • Asia-Pacific Emerging Market Build-Out
  • Non-Viral Platform Diversification
  1. 1 Market Summary | |
    1. 1.1 Study Assumptions & Market Definition | |
    2. 1.2 Scope of the Study | |
    3. 1.3 Research Methodology | |
  2. 2 Key Report Takeaways | |
    1. 2.1 By Product Type | |
    2. 2.2 By Application | |
    3. 2.3 By Region | |
  3. 3 Market Size and Forecast (2021–2035) | |
    1. 3.1 Historical Market Size (2021–2025) | |
    2. 3.2 Current & Forecast Market Size (2026–2035) | |
    3. 3.3 Year-over-Year Growth Analysis | |
  4. 4 Driver Impact Analysis | |
    1. 4.1 Accelerating Gene Therapy Approvals | |
    2. 4.2 GMP Capacity Shortfall and Outsourcing | |
    3. 4.3 Suspension and Perfusion Process Intensification | |
    4. 4.4 CAR-T and Cell Therapy Commercialisation | |
    5. 4.5 Sovereign Biomanufacturing Funding | |
    6. 4.6 Analytical and Regulatory Standardisation | |
  5. 5 Restraints Impact Analysis | |
    1. 5.1 High Cost of Goods Per Dose | |
    2. 5.2 Scale-Up Yield Variability | |
    3. 5.3 Comparability and Regulatory Complexity | |
    4. 5.4 Specialised Workforce Shortage | |
    5. 5.5 Single-Use and Raw Material Supply Constraints | |
  6. 6 Opportunities | |
    1. 6.1 Commercial-Scale Capacity Pre-Booking | |
    2. 6.2 Asia-Pacific Emerging Market Build-Out | |
    3. 6.3 Non-Viral Platform Diversification | |
    4. 6.4 In Vivo Cell Engineering | |
    5. 6.5 Process Data and Platform Licensing | |
  7. 7 Regional Market Share and Country-Level Analysis | |
    1. 7.1 North America | | |
      1. 7.1.1 US | | |
      2. 7.1.2 Canada | | |
      3. 7.1.3 Mexico | |
    2. 7.2 Europe | | |
      1. 7.2.1 Germany | | |
      2. 7.2.2 UK | | |
      3. 7.2.3 France | | |
      4. 7.2.4 Italy | | |
      5. 7.2.5 Spain | | |
      6. 7.2.6 Nordic Countries | | |
      7. 7.2.7 Russia | | |
      8. 7.2.8 Rest of Europe | |
    3. 7.3 Asia-Pacific | | |
      1. 7.3.1 China | | |
      2. 7.3.2 India | | |
      3. 7.3.3 Japan | | |
      4. 7.3.4 South Korea | | |
      5. 7.3.5 ASEAN | | |
      6. 7.3.6 Rest of Asia-Pacific | |
    4. 7.4 South America | | |
      1. 7.4.1 Brazil | | |
      2. 7.4.2 Argentina | | |
      3. 7.4.3 Rest of South America | |
    5. 7.5 Middle East & Africa | | |
      1. 7.5.1 Saudi Arabia | | |
      2. 7.5.2 UAE | | |
      3. 7.5.3 South Africa | | |
      4. 7.5.4 Egypt | | |
      5. 7.5.5 Rest of MEA | |
  8. 8 Future Outlook (2026–2035) | |
    1. 8.1 Machine Learning in Process Development | |
    2. 8.2 Platform Economics and Modular Capacity | |
    3. 8.3 The In Vivo Editing Cycle | |
    4. 8.4 Environmental Footprint and Reporting | |
  9. 9 Segmentation Analysis | |
    1. 9.1 By Product Type | | |
      1. 9.1.1 Plasmid DNA | | |
      2. 9.1.2 Viral Vector | | |
      3. 9.1.3 Non-Viral Vector | |
    2. 9.2 By Application | | |
      1. 9.2.1 Cancer | | |
      2. 9.2.2 Genetic Disorders | | |
      3. 9.2.3 Infectious Diseases | | |
      4. 9.2.4 Ophthalmic Disorders | | |
      5. 9.2.5 Others | |
  10. 10 Competitive Landscape | |
    1. 10.1 Market Concentration Analysis (2026) | |
    2. 10.2 Competitive Benchmarking Matrix | |
    3. 10.3 Company Profiles | |
  11. 11 Recent News & Developments | |
  12. 12 Report Scope and Methodology | |
  13. 13 Detailed Sources and Citations | |
  14. 14 Frequently Asked Questions | | LIST OF TABLES | |
  15. TABLE 1 Global Market Size & Forecast, by Revenue (USD Billion), 2021–2035 | |
  16. TABLE 2 Year-over-Year Growth Analysis, 2021–2035 | |
  17. TABLE 3 Driver Impact Analysis Matrix, 2026–2035 | |
  18. TABLE 4 Restraint Impact Analysis Matrix, 2026–2035 | |
  19. TABLE 5 Regional Market Summary, by Revenue and Growth Rate, 2025 | |
  20. TABLE 6 North America Market Size, by Country, 2021–2035 (USD Billion) | |
  21. TABLE 7 Europe Market Size, by Country, 2021–2035 (USD Billion) | |
  22. TABLE 8 Asia-Pacific Market Size, by Country, 2021–2035 (USD Billion) | |
  23. TABLE 9 South America Market Size, by Country, 2021–2035 (USD Billion) | |
  24. TABLE 10 Middle East & Africa Market Size, by Country, 2021–2035 (USD Billion) | |
  25. TABLE 11 Global Market Size, by Product Type, 2021–2035 (USD Billion) | |
  26. TABLE 12 Global Market Size, by Application, 2021–2035 (USD Billion) | |
  27. TABLE 13 North America Market Size, by Product Type, 2021–2035 (USD Billion) | |
  28. TABLE 14 North America Market Size, by Application, 2021–2035 (USD Billion) | |
  29. TABLE 15 Europe Market Size, by Product Type, 2021–2035 (USD Billion) | |
  30. TABLE 16 Europe Market Size, by Application, 2021–2035 (USD Billion) | |
  31. TABLE 17 Asia-Pacific Market Size, by Product Type, 2021–2035 (USD Billion) | |
  32. TABLE 18 Asia-Pacific Market Size, by Application, 2021–2035 (USD Billion) | |
  33. TABLE 19 South America Market Size, by Product Type, 2021–2035 (USD Billion) | |
  34. TABLE 20 South America Market Size, by Application, 2021–2035 (USD Billion) | |
  35. TABLE 21 Middle East & Africa Market Size, by Product Type, 2021–2035 (USD Billion) | |
  36. TABLE 22 Middle East & Africa Market Size, by Application, 2021–2035 (USD Billion) | |
  37. TABLE 23 Competitive Benchmarking Matrix, 2026 | |
  38. TABLE 24 Company Profiles – Key Players | |
  39. TABLE 25 Recent Developments & Strategic Announcements, 2023–2025 | |
  40. TABLE 26 Report Scope & Methodology Summary | |
  41. TABLE 27 Detailed Sources and Citations | | LIST OF FIGURES | |
  42. FIGURE 1 Market Dynamics – Drivers, Restraints and Opportunities | |
  43. FIGURE 2 Industry Value Chain Analysis | |
  44. FIGURE 3 Porter's Five Forces Analysis | |
  45. FIGURE 4 Global Market Size Trend and Forecast, 2021–2035 (USD Billion) | |
  46. FIGURE 5 Year-over-Year Growth Rate Trend, 2022–2035 (%) | |
  47. FIGURE 6 Market Share by Product Type, 2025 vs 2035 (%) | |
  48. FIGURE 7 Market Share by Application, 2025 vs 2035 (%) | |
  49. FIGURE 8 Regional Revenue Share Distribution, 2025 (%) | |
  50. FIGURE 9 Regional CAGR Comparison, 2026–2035 (%) | |
  51. FIGURE 10 North America Country-Level Revenue Share, 2025 (%) | |
  52. FIGURE 11 Asia-Pacific Country-Level Revenue Share, 2025 (%) | |
  53. FIGURE 12 Competitive Landscape – Estimated Revenue Share Ranges, 2026 | |
  54. FIGURE 13 Market Concentration and Top-Five Supplier Position, 2026

Segmentation Quick Reference

DimensionSub-SegmentsDominant SegmentFastest Growing Segment
By Product TypePlasmid DNA; Viral Vector; Non-Viral VectorViral Vector (51.1% share, 2025)Non-Viral Vector (27.1% CAGR, 2026–2035)
By ApplicationCancer; Genetic Disorders; Infectious Diseases; Ophthalmic Disorders; OthersCancer (44.8% share, 2025)Infectious Diseases (27.5% CAGR, 2026–2035)


Market Segmentation Overview

By Product Type

Sub-SegmentKey Trend
Plasmid DNAGMP-grade supply tightens as both viral assembly and editing payloads compete for the same capacity
Viral VectorSuspension bioreactor migration lifts titres and reduces cost per dose across AAV and lentiviral lines
Non-Viral VectorLipid nanoparticle and electroporation systems enable redosing and simpler scale-up


Viral Vector leads at 51.1% of 2025 revenue because AAV and lentiviral constructs carry approved-product precedent and validated potency assay packages that regulators already accept. Non-Viral Vector grows fastest at a 27.1% CAGR, drawing directly on formulation expertise built during mRNA vaccine programmes and avoiding the pre-existing immunity that prevents viral redosing. Plasmid DNA sits upstream of both and therefore benefits whichever modality gains share, though GMP plasmid lead times remain a recurring constraint on downstream vector scheduling.

By Application

Sub-SegmentKey Trend
CancerAutologous CAR-T volumes tie vector demand directly to treated patient counts
Genetic DisordersHaemophilia, sickle cell and Duchenne launches convert trial supply into commercial contracts
Infectious DiseasesPreparedness budgets renew adenoviral and AAV vaccine backbone orders
Ophthalmic DisordersSmall subretinal dose volumes keep unit economics favourable
OthersNeurological, cardiovascular and metabolic programmes broaden the pipeline base


Cancer holds 44.8% of 2025 revenue because every autologous dose consumes a dedicated lentiviral aliquot, making demand a linear function of patients treated rather than a shared batch economy. Infectious Diseases advances quickest at a 27.5% CAGR as sovereign preparedness programmes provide predictable, contracted offtake that clinical-stage indications cannot match. Ophthalmic Disorders remains the most cost-tolerant application, since subretinal administration needs a fraction of the vector genomes required for systemic delivery, letting it stay commercially viable while manufacturing costs remain high.




Download PDF ×

We do not share your information with anyone. However, we may send you emails based on your report interest from time to time. You may contact us at any time to opt-out.