US Wi Fi Adapter Card Market

ID: MRFR/SEM/12801-HCR
200 Pages
Ankit Gupta
Last Updated: April 06, 2026
US Wi-Fi Adapter Card Market Size, Share and Research Report By Technology (Wi-Fi 5, Wi-Fi 6, Wi-Fi 6E, Wi-Fi 7), By Form Factor (PCIe, USB, M.2, Mini PCIe), By End Use (Residential, Commercial, Industrial) and By Compatibility (Windows, Linux, MacOS) - Industry Forecast Till 2035
Download PDF ×

We do not share your information with anyone. However, we may send you emails based on your report interest from time to time. You may contact us at any time to opt-out.

US Wi Fi Adapter Card Market

Market Size

Forecast Period2025 - 2035
CAGR (2025 - 2035)4.56%
2024 Market Size$ 656.77 Million
2025 Market Size$ 686.72 Million
2035 Market Size$ 1,072.59 Million

Key Players

Intel Corporation
TP-Link Technologies Co Ltd
Netgear Inc
ASUS Computer International
D-Link Corporation Inc
Linksys LLC
Opportunities
  • Increased Use of IoT Devices
  • Growing Cybersecurity Concerns
  • Expansion of Remote Work Culture
  1. 1 SECTION I: EXECUTIVE SUMMARY AND KEY HIGHLIGHTS
    1. 1.1 EXECUTIVE SUMMARY
      1. 1.1.1 Market Overview
      2. 1.1.2 Key Findings
      3. 1.1.3 Market Segmentation
      4. 1.1.4 Competitive Landscape
      5. 1.1.5 Challenges and Opportunities
      6. 1.1.6 Future Outlook
  2. 2 SECTION II: SCOPING, METHODOLOGY AND MARKET STRUCTURE
    1. 2.1 MARKET INTRODUCTION
      1. 2.1.1 Definition
      2. 2.1.2 Scope of the study
        1. 2.1.2.1 Research Objective
        2. 2.1.2.2 Assumption
        3. 2.1.2.3 Limitations
    2. 2.2 RESEARCH METHODOLOGY
      1. 2.2.1 Overview
      2. 2.2.2 Data Mining
      3. 2.2.3 Secondary Research
      4. 2.2.4 Primary Research
        1. 2.2.4.1 Primary Interviews and Information Gathering Process
        2. 2.2.4.2 Breakdown of Primary Respondents
      5. 2.2.5 Forecasting Model
      6. 2.2.6 Market Size Estimation
        1. 2.2.6.1 Bottom-Up Approach
        2. 2.2.6.2 Top-Down Approach
      7. 2.2.7 Data Triangulation
      8. 2.2.8 Validation
  3. 3 SECTION III: QUALITATIVE ANALYSIS
    1. 3.1 MARKET DYNAMICS
      1. 3.1.1 Overview
      2. 3.1.2 Drivers
      3. 3.1.3 Restraints
      4. 3.1.4 Opportunities
    2. 3.2 MARKET FACTOR ANALYSIS
      1. 3.2.1 Value chain Analysis
      2. 3.2.2 Porter's Five Forces Analysis
        1. 3.2.2.1 Bargaining Power of Suppliers
        2. 3.2.2.2 Bargaining Power of Buyers
        3. 3.2.2.3 Threat of New Entrants
        4. 3.2.2.4 Threat of Substitutes
        5. 3.2.2.5 Intensity of Rivalry
      3. 3.2.3 COVID-19 Impact Analysis
        1. 3.2.3.1 Market Impact Analysis
        2. 3.2.3.2 Regional Impact
        3. 3.2.3.3 Opportunity and Threat Analysis
  4. 4 SECTION IV: QUANTITATIVE ANALYSIS
    1. 4.1 Semiconductor & Electronics, BY Technology (USD Million)
      1. 4.1.1 Wi-Fi 5
      2. 4.1.2 Wi-Fi 6
      3. 4.1.3 Wi-Fi 6E
      4. 4.1.4 Wi-Fi 7
    2. 4.2 Semiconductor & Electronics, BY Form Factor (USD Million)
      1. 4.2.1 PCIe
      2. 4.2.2 USB
      3. 4.2.3 Mini PCIe
    3. 4.3 Semiconductor & Electronics, BY End Use (USD Million)
      1. 4.3.1 Residential
      2. 4.3.2 Commercial
      3. 4.3.3 Industrial
    4. 4.4 Semiconductor & Electronics, BY Compatibility (USD Million)
      1. 4.4.1 Windows
      2. 4.4.2 Linux
      3. 4.4.3 MacOS
  5. 5 SECTION V: COMPETITIVE ANALYSIS
    1. 5.1 Competitive Landscape
      1. 5.1.1 Overview
      2. 5.1.2 Competitive Analysis
      3. 5.1.3 Market share Analysis
      4. 5.1.4 Major Growth Strategy in the Semiconductor & Electronics
      5. 5.1.5 Competitive Benchmarking
      6. 5.1.6 Leading Players in Terms of Number of Developments in the Semiconductor & Electronics
      7. 5.1.7 Key developments and growth strategies
        1. 5.1.7.1 New Product Launch/Service Deployment
        2. 5.1.7.2 Merger & Acquisitions
        3. 5.1.7.3 Joint Ventures
      8. 5.1.8 Major Players Financial Matrix
        1. 5.1.8.1 Sales and Operating Income
        2. 5.1.8.2 Major Players R&D Expenditure. 2023
    2. 5.2 Company Profiles
      1. 5.2.1 Intel Corporation (US)
        1. 5.2.1.1 Financial Overview
        2. 5.2.1.2 Products Offered
        3. 5.2.1.3 Key Developments
        4. 5.2.1.4 SWOT Analysis
        5. 5.2.1.5 Key Strategies
      2. 5.2.2 TP-Link Technologies Co Ltd (CN)
        1. 5.2.2.1 Financial Overview
        2. 5.2.2.2 Products Offered
        3. 5.2.2.3 Key Developments
        4. 5.2.2.4 SWOT Analysis
        5. 5.2.2.5 Key Strategies
      3. 5.2.3 Netgear Inc (US)
        1. 5.2.3.1 Financial Overview
        2. 5.2.3.2 Products Offered
        3. 5.2.3.3 Key Developments
        4. 5.2.3.4 SWOT Analysis
        5. 5.2.3.5 Key Strategies
      4. 5.2.4 ASUS Computer International (US)
        1. 5.2.4.1 Financial Overview
        2. 5.2.4.2 Products Offered
        3. 5.2.4.3 Key Developments
        4. 5.2.4.4 SWOT Analysis
        5. 5.2.4.5 Key Strategies
      5. 5.2.5 D-Link Corporation Inc (TW)
        1. 5.2.5.1 Financial Overview
        2. 5.2.5.2 Products Offered
        3. 5.2.5.3 Key Developments
        4. 5.2.5.4 SWOT Analysis
        5. 5.2.5.5 Key Strategies
      6. 5.2.6 Linksys LLC (US)
        1. 5.2.6.1 Financial Overview
        2. 5.2.6.2 Products Offered
        3. 5.2.6.3 Key Developments
        4. 5.2.6.4 SWOT Analysis
        5. 5.2.6.5 Key Strategies
      7. 5.2.7 Zyxel Communications Corp (TW)
        1. 5.2.7.1 Financial Overview
        2. 5.2.7.2 Products Offered
        3. 5.2.7.3 Key Developments
        4. 5.2.7.4 SWOT Analysis
        5. 5.2.7.5 Key Strategies
      8. 5.2.8 Belkin International Inc (US)
        1. 5.2.8.1 Financial Overview
        2. 5.2.8.2 Products Offered
        3. 5.2.8.3 Key Developments
        4. 5.2.8.4 SWOT Analysis
        5. 5.2.8.5 Key Strategies
    3. 5.3 Appendix
      1. 5.3.1 References
      2. 5.3.2 Related Reports
  6. 6 LIST OF FIGURES
    1. 6.1 MARKET SYNOPSIS
    2. 6.2 US MARKET ANALYSIS BY TECHNOLOGY
    3. 6.3 US MARKET ANALYSIS BY FORM FACTOR
    4. 6.4 US MARKET ANALYSIS BY END USE
    5. 6.5 US MARKET ANALYSIS BY COMPATIBILITY
    6. 6.6 KEY BUYING CRITERIA OF SEMICONDUCTOR & ELECTRONICS
    7. 6.7 RESEARCH PROCESS OF MRFR
    8. 6.8 DRO ANALYSIS OF SEMICONDUCTOR & ELECTRONICS
    9. 6.9 DRIVERS IMPACT ANALYSIS: SEMICONDUCTOR & ELECTRONICS
    10. 6.10 RESTRAINTS IMPACT ANALYSIS: SEMICONDUCTOR & ELECTRONICS
    11. 6.11 SUPPLY / VALUE CHAIN: SEMICONDUCTOR & ELECTRONICS
    12. 6.12 SEMICONDUCTOR & ELECTRONICS, BY TECHNOLOGY, 2024 (% SHARE)
    13. 6.13 SEMICONDUCTOR & ELECTRONICS, BY TECHNOLOGY, 2024 TO 2035 (USD Million)
    14. 6.14 SEMICONDUCTOR & ELECTRONICS, BY FORM FACTOR, 2024 (% SHARE)
    15. 6.15 SEMICONDUCTOR & ELECTRONICS, BY FORM FACTOR, 2024 TO 2035 (USD Million)
    16. 6.16 SEMICONDUCTOR & ELECTRONICS, BY END USE, 2024 (% SHARE)
    17. 6.17 SEMICONDUCTOR & ELECTRONICS, BY END USE, 2024 TO 2035 (USD Million)
    18. 6.18 SEMICONDUCTOR & ELECTRONICS, BY COMPATIBILITY, 2024 (% SHARE)
    19. 6.19 SEMICONDUCTOR & ELECTRONICS, BY COMPATIBILITY, 2024 TO 2035 (USD Million)
    20. 6.20 BENCHMARKING OF MAJOR COMPETITORS
  7. 7 LIST OF TABLES
    1. 7.1 LIST OF ASSUMPTIONS
  8. 7.1.1
    1. 7.2 US MARKET SIZE ESTIMATES; FORECAST
      1. 7.2.1 BY TECHNOLOGY, 2025-2035 (USD Million)
      2. 7.2.2 BY FORM FACTOR, 2025-2035 (USD Million)
      3. 7.2.3 BY END USE, 2025-2035 (USD Million)
      4. 7.2.4 BY COMPATIBILITY, 2025-2035 (USD Million)
    2. 7.3 PRODUCT LAUNCH/PRODUCT DEVELOPMENT/APPROVAL
  9. 7.3.1
    1. 7.4 ACQUISITION/PARTNERSHIP
  10. 7.4.1

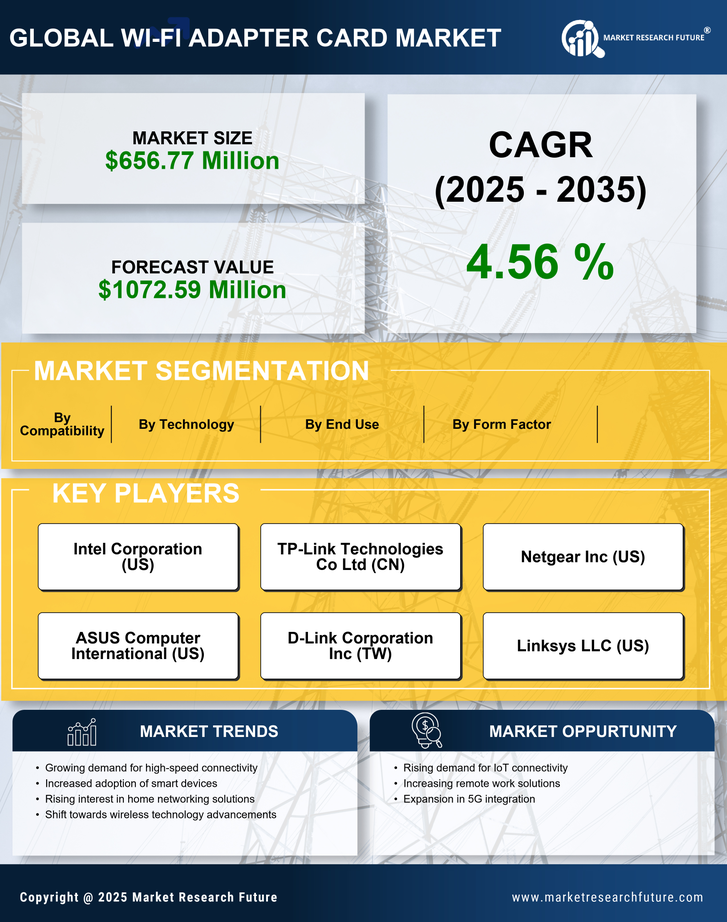
US Wi Fi Adapter Card Market Segmentation

US Wi Fi Adapter Card Market By Technology (USD Million, 2025-2035)

  • Wi-Fi 5
  • Wi-Fi 6
  • Wi-Fi 6E
  • Wi-Fi 7

US Wi Fi Adapter Card Market By Form Factor (USD Million, 2025-2035)

  • PCIe
  • USB
  • Mini PCIe

US Wi Fi Adapter Card Market By End Use (USD Million, 2025-2035)

  • Residential
  • Commercial
  • Industrial

US Wi Fi Adapter Card Market By Compatibility (USD Million, 2025-2035)

  • Windows
  • Linux
  • MacOS