US US Wearable Display Device Materials Market Segmentation
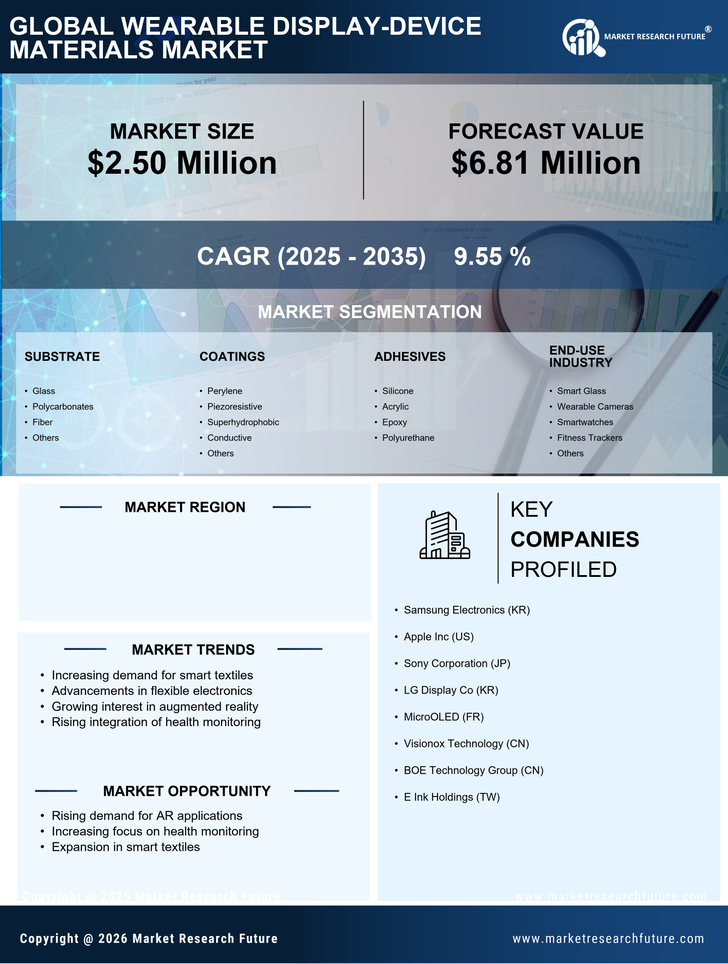
US Wearable Display Device Materials Market By Substrate (USD Million, 2025-2035)
- Glass
- Polycarbonates
- Fiber
- Others
US Wearable Display Device Materials Market By Coatings (USD Million, 2025-2035)
- Perylene
- Piezoresistive
- Superhydrophobic
- Conductive
- Others
US Wearable Display Device Materials Market By Adhesives (USD Million, 2025-2035)
- Silicone
- Acrylic
- Epoxy
- Polyurethane
US Wearable Display Device Materials Market By End-Use Industry (USD Million, 2025-2035)
- Smart Glass
- Wearable Cameras
- Smartwatches
- Fitness Trackers
- Others