US US Underground Mining Equipment Market Segmentation
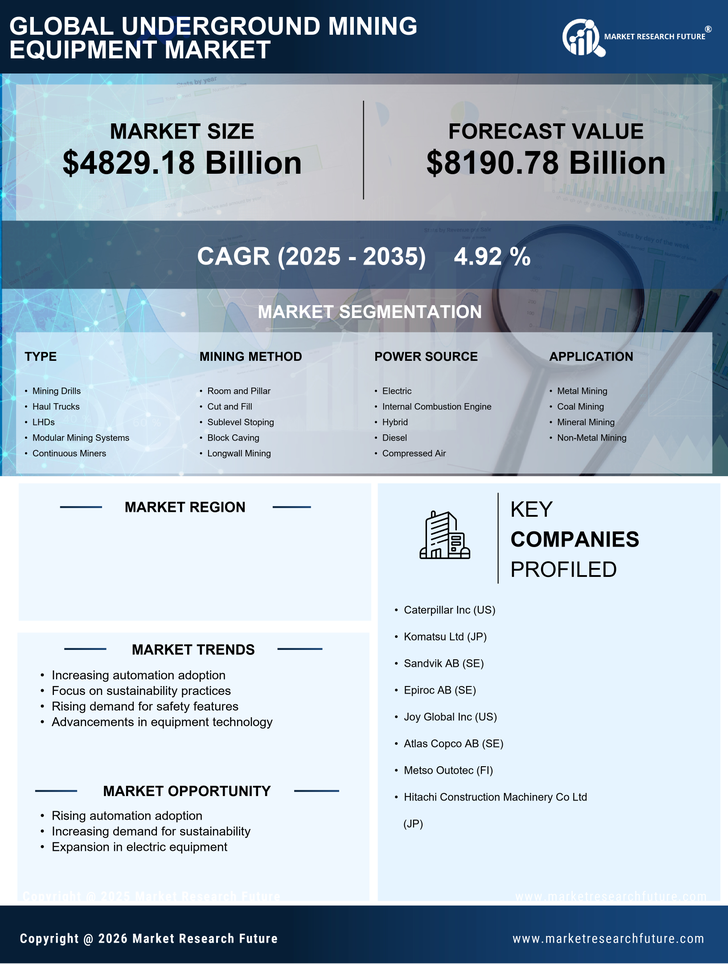
US Underground Mining Equipment Market By Type (USD Billion, 2025-2035)
- Mining Drills
- Haul Trucks
- LHDs
- Modular Mining Systems
- Continuous Miners
US Underground Mining Equipment Market By Mining Method (USD Billion, 2025-2035)
- Room and Pillar
- Cut and Fill
- Sublevel Stoping
- Block Caving
- Longwall Mining
US Underground Mining Equipment Market By Power Source (USD Billion, 2025-2035)
- Electric
- Internal Combustion Engine
- Hybrid
- Diesel
- Compressed Air
US Underground Mining Equipment Market By Application (USD Billion, 2025-2035)
- Metal Mining
- Coal Mining
- Mineral Mining
- Non-Metal Mining