US Transparent Barrier Packaging Films Market

ID: MRFR/PCM/18674-CR
100 Pages
Garvit Vyas
Last Updated: May 12, 2026
US Transparent Barrier Packaging Films Market Research Report By Thickness (Below 25 Microns, 25 to 50 Microns, 50 to 75 Microns, Above 75 Microns), By Application (Food Packaging, Pharmaceutical Packaging, Cosmetic Packaging, Electronics Packaging), By Material Type (Polypropylene, Polyethylene, Polyester, Polyvinyl Chloride), By End-Use Industry (Food and Beverages, Healthcare, Personal Care, Electronics) - Forecast to 2035
Download PDF ×

We do not share your information with anyone. However, we may send you emails based on your report interest from time to time. You may contact us at any time to opt-out.

US Transparent Barrier Packaging Films Market

Market Size

Forecast Period2025 - 2035
CAGR (2025 - 2035)4.65%
2024 Market Size$ 4,750 Million
2025 Market Size$ 4,970.87 Million
2035 Market Size$ 7,830 Million

Key Players

Amcor
BASF
Sealed Air
Mondi Group
DuPont
Berry Global
Opportunities
  • Growth in the Beverage Industry
  • Rising Demand for Food Preservation
  • Technological Innovations in Packaging
  1. SECTION I: EXECUTIVE SUMMARY AND KEY HIGHLIGHTS |
    1. 1.1 EXECUTIVE SUMMARY | |
      1. 1.1.1 Market Overview | |
      2. 1.1.2 Key Findings | |
      3. 1.1.3 Market Segmentation | |
      4. 1.1.4 Competitive Landscape | |
      5. 1.1.5 Challenges and Opportunities | |
      6. 1.1.6 Future Outlook 2
  2. SECTION II: SCOPING, METHODOLOGY AND MARKET STRUCTURE |
    1. 2.1 MARKET INTRODUCTION | |
      1. 2.1.1 Definition | |
      2. 2.1.2 Scope of the study | | |
        1. 2.1.2.1 Research Objective | | |
        2. 2.1.2.2 Assumption | | |
        3. 2.1.2.3 Limitations |
    2. 2.2 RESEARCH METHODOLOGY | |
      1. 2.2.1 Overview | |
      2. 2.2.2 Data Mining | |
      3. 2.2.3 Secondary Research | |
      4. 2.2.4 Primary Research | | |
        1. 2.2.4.1 Primary Interviews and Information Gathering Process | | |
        2. 2.2.4.2 Breakdown of Primary Respondents | |
      5. 2.2.5 Forecasting Model | |
      6. 2.2.6 Market Size Estimation | | |
        1. 2.2.6.1 Bottom-Up Approach | | |
        2. 2.2.6.2 Top-Down Approach | |
      7. 2.2.7 Data Triangulation | |
      8. 2.2.8 Validation 3
  3. SECTION III: QUALITATIVE ANALYSIS |
    1. 3.1 MARKET DYNAMICS | |
      1. 3.1.1 Overview | |
      2. 3.1.2 Drivers | |
      3. 3.1.3 Restraints | |
      4. 3.1.4 Opportunities |
    2. 3.2 MARKET FACTOR ANALYSIS | |
      1. 3.2.1 Value chain Analysis | |
      2. 3.2.2 Porter's Five Forces Analysis | | |
        1. 3.2.2.1 Bargaining Power of Suppliers | | |
        2. 3.2.2.2 Bargaining Power of Buyers | | |
        3. 3.2.2.3 Threat of New Entrants | | |
        4. 3.2.2.4 Threat of Substitutes | | |
        5. 3.2.2.5 Intensity of Rivalry | |
      3. 3.2.3 COVID-19 Impact Analysis | | |
        1. 3.2.3.1 Market Impact Analysis | | |
        2. 3.2.3.2 Regional Impact | | |
        3. 3.2.3.3 Opportunity and Threat Analysis 4
  4. SECTION IV: QUANTITATIVE ANALYSIS |
    1. 4.1 Packaging & Transport, BY Application (USD Million) | |
      1. 4.1.1 Food Packaging | |
      2. 4.1.2 Pharmaceutical Packaging | |
      3. 4.1.3 Cosmetic Packaging | |
      4. 4.1.4 Electronics Packaging |
    2. 4.2 Packaging & Transport, BY Material Type (USD Million) | |
      1. 4.2.1 Polypropylene | |
      2. 4.2.2 Polyethylene | |
      3. 4.2.3 Polyester | |
      4. 4.2.4 Polyvinyl Chloride |
    3. 4.3 Packaging & Transport, BY End Use Industry (USD Million) | |
      1. 4.3.1 Food and Beverages | |
      2. 4.3.2 Healthcare | |
      3. 4.3.3 Personal Care | |
      4. 4.3.4 Electronics |
    4. 4.4 Packaging & Transport, BY Thickness (USD Million) | |
      1. 4.4.1 Below 25 Microns | |
      2. 4.4.2 25 to 50 Microns | |
      3. 4.4.3 50 to 75 Microns | |
      4. 4.4.4 Above 75 Microns 5
  5. SECTION V: COMPETITIVE ANALYSIS |
    1. 5.1 Competitive Landscape | |
      1. 5.1.1 Overview | |
      2. 5.1.2 Competitive Analysis | |
      3. 5.1.3 Market share Analysis | |
      4. 5.1.4 Major Growth Strategy in the Packaging & Transport | |
      5. 5.1.5 Competitive Benchmarking | |
      6. 5.1.6 Leading Players in Terms of Number of Developments in the Packaging & Transport | |
      7. 5.1.7 Key developments and growth strategies | | |
        1. 5.1.7.1 New Product Launch/Service Deployment | | |
        2. 5.1.7.2 Merger & Acquisitions | | |
        3. 5.1.7.3 Joint Ventures | |
      8. 5.1.8 Major Players Financial Matrix | | |
        1. 5.1.8.1 Sales and Operating Income | | |
        2. 5.1.8.2 Major Players R&D Expenditure. 2023 |
    2. 5.2 Company Profiles | |
      1. 5.2.1 Amcor (AU) | | |
        1. 5.2.1.1 Financial Overview | | |
        2. 5.2.1.2 Products Offered | | |
        3. 5.2.1.3 Key Developments | | |
        4. 5.2.1.4 SWOT Analysis | | |
        5. 5.2.1.5 Key Strategies | |
      2. 5.2.2 BASF (DE) | | |
        1. 5.2.2.1 Financial Overview | | |
        2. 5.2.2.2 Products Offered | | |
        3. 5.2.2.3 Key Developments | | |
        4. 5.2.2.4 SWOT Analysis | | |
        5. 5.2.2.5 Key Strategies | |
      3. 5.2.3 Sealed Air (US) | | |
        1. 5.2.3.1 Financial Overview | | |
        2. 5.2.3.2 Products Offered | | |
        3. 5.2.3.3 Key Developments | | |
        4. 5.2.3.4 SWOT Analysis | | |
        5. 5.2.3.5 Key Strategies | |
      4. 5.2.4 Mondi Group (GB) | | |
        1. 5.2.4.1 Financial Overview | | |
        2. 5.2.4.2 Products Offered | | |
        3. 5.2.4.3 Key Developments | | |
        4. 5.2.4.4 SWOT Analysis | | |
        5. 5.2.4.5 Key Strategies | |
      5. 5.2.5 DuPont (US) | | |
        1. 5.2.5.1 Financial Overview | | |
        2. 5.2.5.2 Products Offered | | |
        3. 5.2.5.3 Key Developments | | |
        4. 5.2.5.4 SWOT Analysis | | |
        5. 5.2.5.5 Key Strategies | |
      6. 5.2.6 Berry Global (US) | | |
        1. 5.2.6.1 Financial Overview | | |
        2. 5.2.6.2 Products Offered | | |
        3. 5.2.6.3 Key Developments | | |
        4. 5.2.6.4 SWOT Analysis | | |
        5. 5.2.6.5 Key Strategies | |
      7. 5.2.7 Clondalkin Group (IE) | | |
        1. 5.2.7.1 Financial Overview | | |
        2. 5.2.7.2 Products Offered | | |
        3. 5.2.7.3 Key Developments | | |
        4. 5.2.7.4 SWOT Analysis | | |
        5. 5.2.7.5 Key Strategies | |
      8. 5.2.8 Kraton Corporation (US) | | |
        1. 5.2.8.1 Financial Overview | | |
        2. 5.2.8.2 Products Offered | | |
        3. 5.2.8.3 Key Developments | | |
        4. 5.2.8.4 SWOT Analysis | | |
        5. 5.2.8.5 Key Strategies | |
      9. 5.2.9 Toray Industries (JP) | | |
        1. 5.2.9.1 Financial Overview | | |
        2. 5.2.9.2 Products Offered | | |
        3. 5.2.9.3 Key Developments | | |
        4. 5.2.9.4 SWOT Analysis | | |
        5. 5.2.9.5 Key Strategies |
    3. 5.3 Appendix | |
      1. 5.3.1 References | |
      2. 5.3.2 Related Reports 6 LIST OF FIGURES |
    4. 6.1 MARKET SYNOPSIS |
    5. 6.2 US MARKET ANALYSIS BY APPLICATION |
    6. 6.3 US MARKET ANALYSIS BY MATERIAL TYPE |
    7. 6.4 US MARKET ANALYSIS BY END USE INDUSTRY |
    8. 6.5 US MARKET ANALYSIS BY THICKNESS |
    9. 6.6 KEY BUYING CRITERIA OF PACKAGING & TRANSPORT |
    10. 6.7 RESEARCH PROCESS OF MRFR |
    11. 6.8 DRO ANALYSIS OF PACKAGING & TRANSPORT |
    12. 6.9 DRIVERS IMPACT ANALYSIS: PACKAGING & TRANSPORT |
    13. 6.10 RESTRAINTS IMPACT ANALYSIS: PACKAGING & TRANSPORT |
    14. 6.11 SUPPLY / VALUE CHAIN: PACKAGING & TRANSPORT |
    15. 6.12 PACKAGING & TRANSPORT, BY APPLICATION, 2024 (% SHARE) |
    16. 6.13 PACKAGING & TRANSPORT, BY APPLICATION, 2024 TO 2035 (USD Million) |
    17. 6.14 PACKAGING & TRANSPORT, BY MATERIAL TYPE, 2024 (% SHARE) |
    18. 6.15 PACKAGING & TRANSPORT, BY MATERIAL TYPE, 2024 TO 2035 (USD Million) |
    19. 6.16 PACKAGING & TRANSPORT, BY END USE INDUSTRY, 2024 (% SHARE) |
    20. 6.17 PACKAGING & TRANSPORT, BY END USE INDUSTRY, 2024 TO 2035 (USD Million) |
    21. 6.18 PACKAGING & TRANSPORT, BY THICKNESS, 2024 (% SHARE) |
    22. 6.19 PACKAGING & TRANSPORT, BY THICKNESS, 2024 TO 2035 (USD Million) |
    23. 6.20 BENCHMARKING OF MAJOR COMPETITORS 7 LIST OF TABLES |
    24. 7.1 LIST OF ASSUMPTIONS | |
      1. 7.1.1 |
    25. 7.2 US MARKET SIZE ESTIMATES; FORECAST | |
      1. 7.2.1 BY APPLICATION, 2025-2035 (USD Million) | |
      2. 7.2.2 BY MATERIAL TYPE, 2025-2035 (USD Million) | |
      3. 7.2.3 BY END USE INDUSTRY, 2025-2035 (USD Million) | |
      4. 7.2.4 BY THICKNESS, 2025-2035 (USD Million) |
    26. 7.3 PRODUCT LAUNCH/PRODUCT DEVELOPMENT/APPROVAL | |
      1. 7.3.1 |
    27. 7.4 ACQUISITION/PARTNERSHIP | |

US Transparent Barrier Packaging Films Market Segmentation

US Transparent Barrier Packaging Films Market By Application (USD Million, 2025-2035)
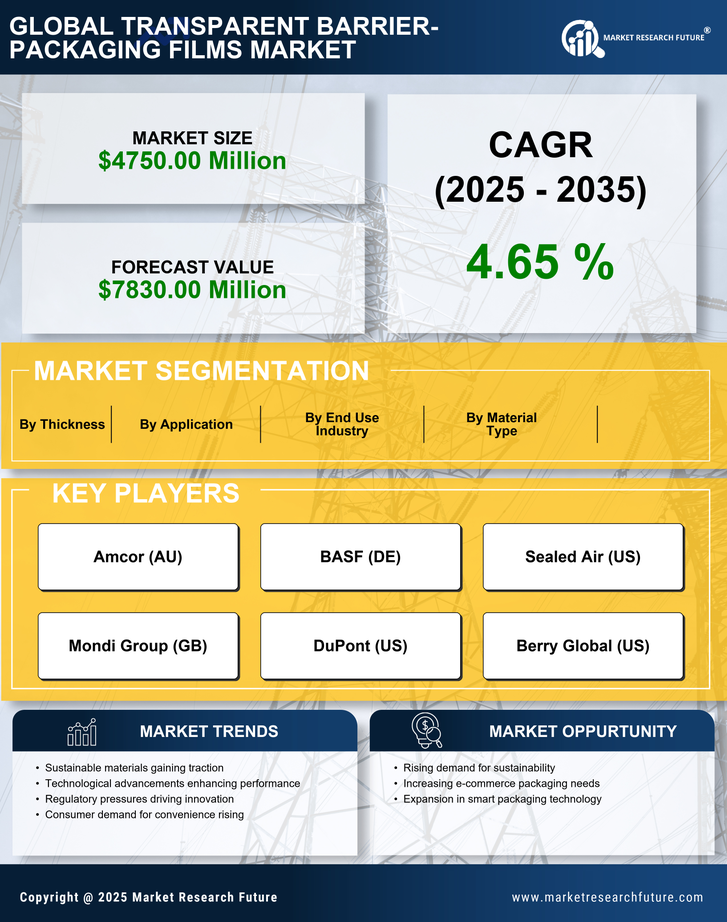
  • Food Packaging
  • Pharmaceutical Packaging
  • Cosmetic Packaging
  • Electronics Packaging

US Transparent Barrier Packaging Films Market By Material Type (USD Million, 2025-2035)

  • Polypropylene
  • Polyethylene
  • Polyester
  • Polyvinyl Chloride

US Transparent Barrier Packaging Films Market By End Use Industry (USD Million, 2025-2035)

  • Food and Beverages
  • Healthcare
  • Personal Care
  • Electronics

US Transparent Barrier Packaging Films Market By Thickness (USD Million, 2025-2035)

  • Below 25 Microns
  • 25 to 50 Microns
  • 50 to 75 Microns
  • Above 75 Microns