US Transfer Membrane Market Segmentation
US Transfer Membrane Market By Type (USD Million, 2025-2035)
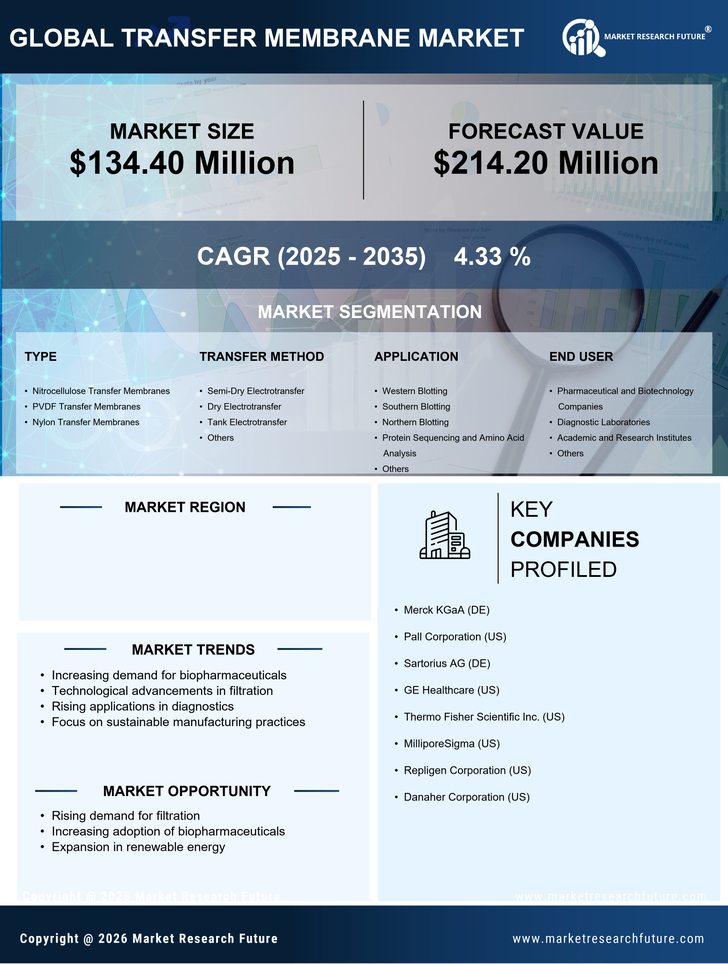
- Nitrocellulose Transfer Membranes
- PVDF Transfer Membranes
- Nylon Transfer Membranes
US Transfer Membrane Market By Transfer Method (USD Million, 2025-2035)
- Semi-Dry Electrotransfer
- Dry Electrotransfer
- Tank Electrotransfer
- Others
US Transfer Membrane Market By Application (USD Million, 2025-2035)
- Western Blotting
- Southern Blotting
- Northern Blotting
- Protein Sequencing and Amino Acid Analysis
- Others
US Transfer Membrane Market By End User (USD Million, 2025-2035)
- Pharmaceutical and Biotechnology Companies
- Diagnostic Laboratories
- Academic and Research Institutes
- Others