US US Silicon Wafers Market Segmentation
US Silicon Wafers Market By Wafer Size (USD Million, 2025-2035)
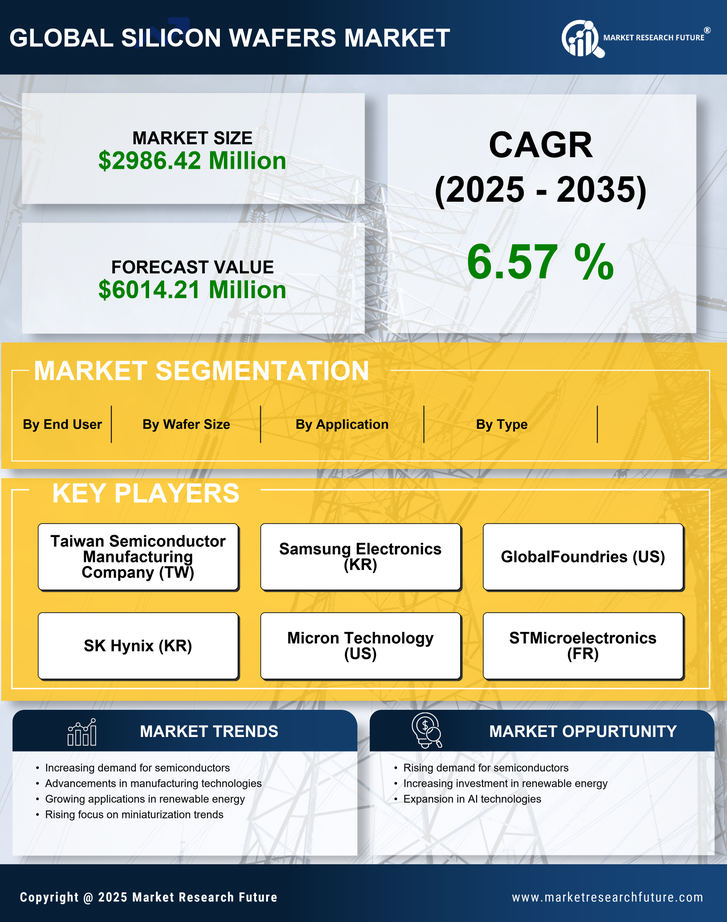
- 0-100 mm
- 100-200 mm
- 200-300 mm
- More than 300 mm
US Silicon Wafers Market By Type (USD Million, 2025-2035)
- N-type
- P-type
US Silicon Wafers Market By Application (USD Million, 2025-2035)
- Solar Cells
- Photoelectric Cells
- Integrated Circuits
- Others
US Silicon Wafers Market By End User (USD Million, 2025-2035)
- Consumer Electronics
- Automotive
- Industrial
- Telecommunications
- Others