US Medical Device Market Segmentation
Medical Device By Component (USD Million, 2025-2035)
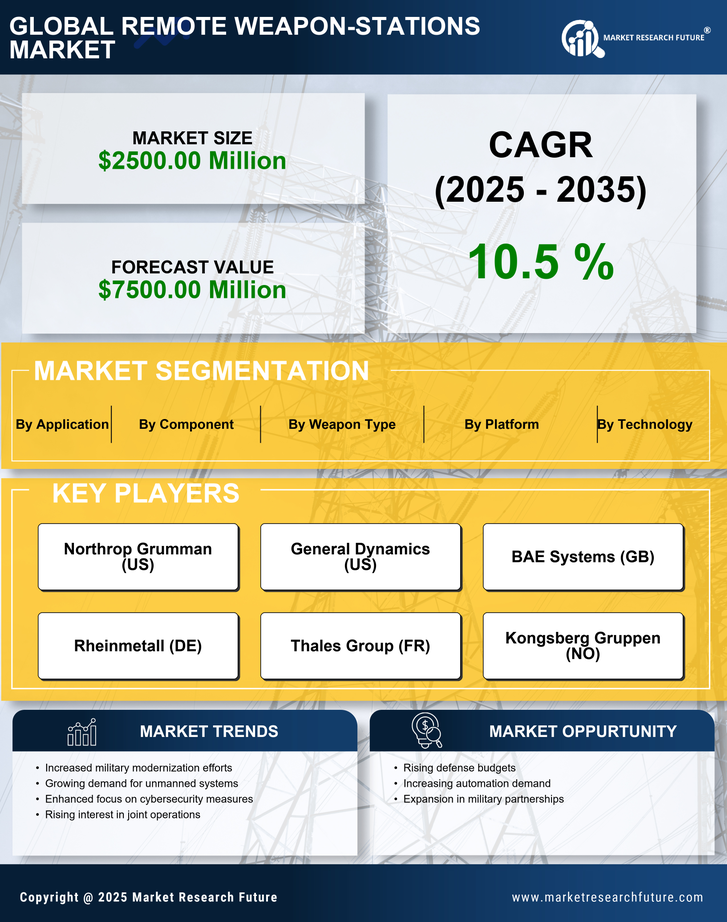
- Human Machine Interface
- Sensors
- Weapons
- Armaments
Medical Device By Platform (USD Million, 2025-2035)
- Land
- Naval
- Airborne
Medical Device By Weapon Type (USD Million, 2025-2035)
- Lethal Weapons
- Non-lethal Weapons
Medical Device By Application (USD Million, 2025-2035)
- Military
- Homeland Security
Medical Device By Technology (USD Million, 2025-2035)
- Close-in Weapon Systems
- Remote Controlled Gun Systems
- Others