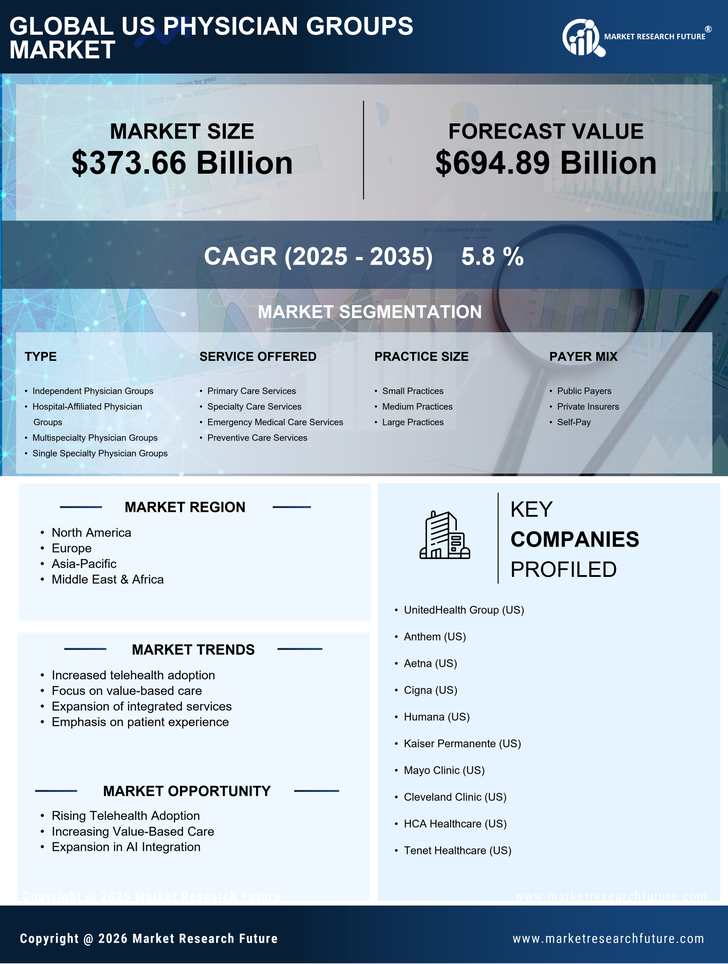
Request Free Sample ×

Kindly complete the form below to receive a free sample of this Report

* Please use a valid business email

Leading companies partner with us for data-driven Insights

clients tt-cursor
Hero Background

US Physician Groups Market

ID: MRFR/HC/13162-HCR
128 Pages
Rahul Gotadki
Last Updated: April 08, 2026

US Physician Groups Market Research Report By Type of Physician Groups (Independent Physician Groups, Hospital-Affiliated Physician Groups, Multispecialty Physician Groups, Single Specialty Physician Groups), By Service Offered (Primary Care Services, Specialty Care Services, Emergency Care Services, Preventive Care Services), By Practice Size (Small Practices, Medium Practices, Large Practices) and By Payer Mix (Public Payers, Private Insurers, Self-Pay) - Industry Forecast to 2035

Share:
Download PDF ×

We do not share your information with anyone. However, we may send you emails based on your report interest from time to time. You may contact us at any time to opt-out.

US Physician Groups Market Infographic
Purchase Options
  1. SECTION I: EXECUTIVE SUMMARY AND KEY HIGHLIGHTS |
    1. 1.1 EXECUTIVE SUMMARY | |
      1. 1.1.1 Market Overview | |
      2. 1.1.2 Key Findings | |
      3. 1.1.3 Market Segmentation | |
      4. 1.1.4 Competitive Landscape | |
      5. 1.1.5 Challenges and Opportunities | |
      6. 1.1.6 Future Outlook 2
  2. SECTION II: SCOPING, METHODOLOGY AND MARKET STRUCTURE |
    1. 2.1 MARKET INTRODUCTION | |
      1. 2.1.1 Definition | |
      2. 2.1.2 Scope of the study | | |
        1. 2.1.2.1 Research Objective | | |
        2. 2.1.2.2 Assumption | | |
        3. 2.1.2.3 Limitations |
    2. 2.2 RESEARCH METHODOLOGY | |
      1. 2.2.1 Overview | |
      2. 2.2.2 Data Mining | |
      3. 2.2.3 Secondary Research | |
      4. 2.2.4 Primary Research | | |
        1. 2.2.4.1 Primary Interviews and Information Gathering Process | | |
        2. 2.2.4.2 Breakdown of Primary Respondents | |
      5. 2.2.5 Forecasting Model | |
      6. 2.2.6 Market Size Estimation | | |
        1. 2.2.6.1 Bottom-Up Approach | | |
        2. 2.2.6.2 Top-Down Approach | |
      7. 2.2.7 Data Triangulation | |
      8. 2.2.8 Validation 3
  3. SECTION III: QUALITATIVE ANALYSIS |
    1. 3.1 MARKET DYNAMICS | |
      1. 3.1.1 Overview | |
      2. 3.1.2 Drivers | |
      3. 3.1.3 Restraints | |
      4. 3.1.4 Opportunities |
    2. 3.2 MARKET FACTOR ANALYSIS | |
      1. 3.2.1 Value chain Analysis | |
      2. 3.2.2 Porter's Five Forces Analysis | | |
        1. 3.2.2.1 Bargaining Power of Suppliers | | |
        2. 3.2.2.2 Bargaining Power of Buyers | | |
        3. 3.2.2.3 Threat of New Entrants | | |
        4. 3.2.2.4 Threat of Substitutes | | |
        5. 3.2.2.5 Intensity of Rivalry | |
      3. 3.2.3 COVID-19 Impact Analysis | | |
        1. 3.2.3.1 Market Impact Analysis | | |
        2. 3.2.3.2 Regional Impact | | |
        3. 3.2.3.3 Opportunity and Threat Analysis 4
  4. SECTION IV: QUANTITATIVE ANALYSIS |
    1. 4.1 Healthcare, BY Specialty Type (USD Billion) | |
      1. 4.1.1 Primary Care | |
      2. 4.1.2 Cardiology | |
      3. 4.1.3 Orthopedics | |
      4. 4.1.4 Pediatrics | |
      5. 4.1.5 Oncology |
    2. 4.2 Healthcare, BY Practice Size (USD Billion) | |
      1. 4.2.1 Solo Practice | |
      2. 4.2.2 Small Group | |
      3. 4.2.3 Medium Group | |
      4. 4.2.4 Large Group |
    3. 4.3 Healthcare, BY Ownership Structure (USD Billion) | |
      1. 4.3.1 Independent Practice | |
      2. 4.3.2 Hospital-Owned | |
      3. 4.3.3 Private Equity-Backed | |
      4. 4.3.4 Non-Profit |
    4. 4.4 Healthcare, BY Service Offering (USD Billion) | |
      1. 4.4.1 Inpatient Care | |
      2. 4.4.2 Outpatient Care | |
      3. 4.4.3 Telemedicine | |
      4. 4.4.4 Preventive Care |
    5. 4.5 Healthcare, BY Patient Demographics (USD Billion) | |
      1. 4.5.1 Pediatric | |
      2. 4.5.2 Adult | |
      3. 4.5.3 Geriatric | |
      4. 4.5.4 Chronic Illness 5
  5. SECTION V: COMPETITIVE ANALYSIS |
    1. 5.1 Competitive Landscape | |
      1. 5.1.1 Overview | |
      2. 5.1.2 Competitive Analysis | |
      3. 5.1.3 Market share Analysis | |
      4. 5.1.4 Major Growth Strategy in the Healthcare | |
      5. 5.1.5 Competitive Benchmarking | |
      6. 5.1.6 Leading Players in Terms of Number of Developments in the Healthcare | |
      7. 5.1.7 Key developments and growth strategies | | |
        1. 5.1.7.1 New Product Launch/Service Deployment | | |
        2. 5.1.7.2 Merger & Acquisitions | | |
        3. 5.1.7.3 Joint Ventures | |
      8. 5.1.8 Major Players Financial Matrix | | |
        1. 5.1.8.1 Sales and Operating Income | | |
        2. 5.1.8.2 Major Players R&D Expenditure. 2023 |
    2. 5.2 Company Profiles | |
      1. 5.2.1 UnitedHealth Group (US) | | |
        1. 5.2.1.1 Financial Overview | | |
        2. 5.2.1.2 Products Offered | | |
        3. 5.2.1.3 Key Developments | | |
        4. 5.2.1.4 SWOT Analysis | | |
        5. 5.2.1.5 Key Strategies | |
      2. 5.2.2 Anthem (US) | | |
        1. 5.2.2.1 Financial Overview | | |
        2. 5.2.2.2 Products Offered | | |
        3. 5.2.2.3 Key Developments | | |
        4. 5.2.2.4 SWOT Analysis | | |
        5. 5.2.2.5 Key Strategies | |
      3. 5.2.3 Aetna (US) | | |
        1. 5.2.3.1 Financial Overview | | |
        2. 5.2.3.2 Products Offered | | |
        3. 5.2.3.3 Key Developments | | |
        4. 5.2.3.4 SWOT Analysis | | |
        5. 5.2.3.5 Key Strategies | |
      4. 5.2.4 Cigna (US) | | |
        1. 5.2.4.1 Financial Overview | | |
        2. 5.2.4.2 Products Offered | | |
        3. 5.2.4.3 Key Developments | | |
        4. 5.2.4.4 SWOT Analysis | | |
        5. 5.2.4.5 Key Strategies | |
      5. 5.2.5 Humana (US) | | |
        1. 5.2.5.1 Financial Overview | | |
        2. 5.2.5.2 Products Offered | | |
        3. 5.2.5.3 Key Developments | | |
        4. 5.2.5.4 SWOT Analysis | | |
        5. 5.2.5.5 Key Strategies | |
      6. 5.2.6 Kaiser Permanente (US) | | |
        1. 5.2.6.1 Financial Overview | | |
        2. 5.2.6.2 Products Offered | | |
        3. 5.2.6.3 Key Developments | | |
        4. 5.2.6.4 SWOT Analysis | | |
        5. 5.2.6.5 Key Strategies | |
      7. 5.2.7 Tenet Healthcare (US) | | |
        1. 5.2.7.1 Financial Overview | | |
        2. 5.2.7.2 Products Offered | | |
        3. 5.2.7.3 Key Developments | | |
        4. 5.2.7.4 SWOT Analysis | | |
        5. 5.2.7.5 Key Strategies | |
      8. 5.2.8 HCA Healthcare (US) | | |
        1. 5.2.8.1 Financial Overview | | |
        2. 5.2.8.2 Products Offered | | |
        3. 5.2.8.3 Key Developments | | |
        4. 5.2.8.4 SWOT Analysis | | |
        5. 5.2.8.5 Key Strategies | |
      9. 5.2.9 Community Health Systems (US) | | |
        1. 5.2.9.1 Financial Overview | | |
        2. 5.2.9.2 Products Offered | | |
        3. 5.2.9.3 Key Developments | | |
        4. 5.2.9.4 SWOT Analysis | | |
        5. 5.2.9.5 Key Strategies | |
      10. 5.2.10 Magellan Health (US) | | |
        1. 5.2.10.1 Financial Overview | | |
        2. 5.2.10.2 Products Offered | | |
        3. 5.2.10.3 Key Developments | | |
        4. 5.2.10.4 SWOT Analysis | | |
        5. 5.2.10.5 Key Strategies |
    3. 5.3 Appendix | |
      1. 5.3.1 References | |
      2. 5.3.2 Related Reports 6 LIST OF FIGURES |
    4. 6.1 MARKET SYNOPSIS |
    5. 6.2 US MARKET ANALYSIS BY SPECIALTY TYPE |
    6. 6.3 US MARKET ANALYSIS BY PRACTICE SIZE |
    7. 6.4 US MARKET ANALYSIS BY OWNERSHIP STRUCTURE |
    8. 6.5 US MARKET ANALYSIS BY SERVICE OFFERING |
    9. 6.6 US MARKET ANALYSIS BY PATIENT DEMOGRAPHICS |
    10. 6.7 KEY BUYING CRITERIA OF HEALTHCARE |
    11. 6.8 RESEARCH PROCESS OF MRFR |
    12. 6.9 DRO ANALYSIS OF HEALTHCARE |
    13. 6.10 DRIVERS IMPACT ANALYSIS: HEALTHCARE |
    14. 6.11 RESTRAINTS IMPACT ANALYSIS: HEALTHCARE |
    15. 6.12 SUPPLY / VALUE CHAIN: HEALTHCARE |
    16. 6.13 HEALTHCARE, BY SPECIALTY TYPE, 2024 (% SHARE) |
    17. 6.14 HEALTHCARE, BY SPECIALTY TYPE, 2024 TO 2035 (USD Billion) |
    18. 6.15 HEALTHCARE, BY PRACTICE SIZE, 2024 (% SHARE) |
    19. 6.16 HEALTHCARE, BY PRACTICE SIZE, 2024 TO 2035 (USD Billion) |
    20. 6.17 HEALTHCARE, BY OWNERSHIP STRUCTURE, 2024 (% SHARE) |
    21. 6.18 HEALTHCARE, BY OWNERSHIP STRUCTURE, 2024 TO 2035 (USD Billion) |
    22. 6.19 HEALTHCARE, BY SERVICE OFFERING, 2024 (% SHARE) |
    23. 6.20 HEALTHCARE, BY SERVICE OFFERING, 2024 TO 2035 (USD Billion) |
    24. 6.21 HEALTHCARE, BY PATIENT DEMOGRAPHICS, 2024 (% SHARE) |
    25. 6.22 HEALTHCARE, BY PATIENT DEMOGRAPHICS, 2024 TO 2035 (USD Billion) |
    26. 6.23 BENCHMARKING OF MAJOR COMPETITORS 7 LIST OF TABLES |
    27. 7.1 LIST OF ASSUMPTIONS | |
      1. 7.1.1 |
    28. 7.2 US MARKET SIZE ESTIMATES; FORECAST | |
      1. 7.2.1 BY SPECIALTY TYPE, 2026-2035 (USD Billion) | |
      2. 7.2.2 BY PRACTICE SIZE, 2026-2035 (USD Billion) | |
      3. 7.2.3 BY OWNERSHIP STRUCTURE, 2026-2035 (USD Billion) | |
      4. 7.2.4 BY SERVICE OFFERING, 2026-2035 (USD Billion) | |
      5. 7.2.5 BY PATIENT DEMOGRAPHICS, 2026-2035 (USD Billion) |
    29. 7.3 PRODUCT LAUNCH/PRODUCT DEVELOPMENT/APPROVAL | |
      1. 7.3.1 |
    30. 7.4 ACQUISITION/PARTNERSHIP | |

US Healthcare Market Segmentation

Healthcare By Specialty Type (USD Billion, 2026-2035)

  • Primary Care
  • Cardiology
  • Orthopedics
  • Pediatrics
  • Oncology

Healthcare By Practice Size (USD Billion, 2026-2035)

  • Solo Practice
  • Small Group
  • Medium Group
  • Large Group

Healthcare By Ownership Structure (USD Billion, 2026-2035)

  • Independent Practice
  • Hospital-Owned
  • Private Equity-Backed
  • Non-Profit

Healthcare By Service Offering (USD Billion, 2026-2035)

  • Inpatient Care
  • Outpatient Care
  • Telemedicine
  • Preventive Care

Healthcare By Patient Demographics (USD Billion, 2026-2035)

  • Pediatric
  • Adult
  • Geriatric
  • Chronic Illness

Compare Licence

×
Features License Type
Single User Multiuser License Enterprise User
Price $4,950 $5,950 $7,250
Maximum User Access Limit 1 User Upto 10 Users Unrestricted Access Throughout the Organization
Free Customization
Direct Access to Analyst
Deliverable Format
Platform Access
Discount on Next Purchase 10% 15% 15%
Printable Versions