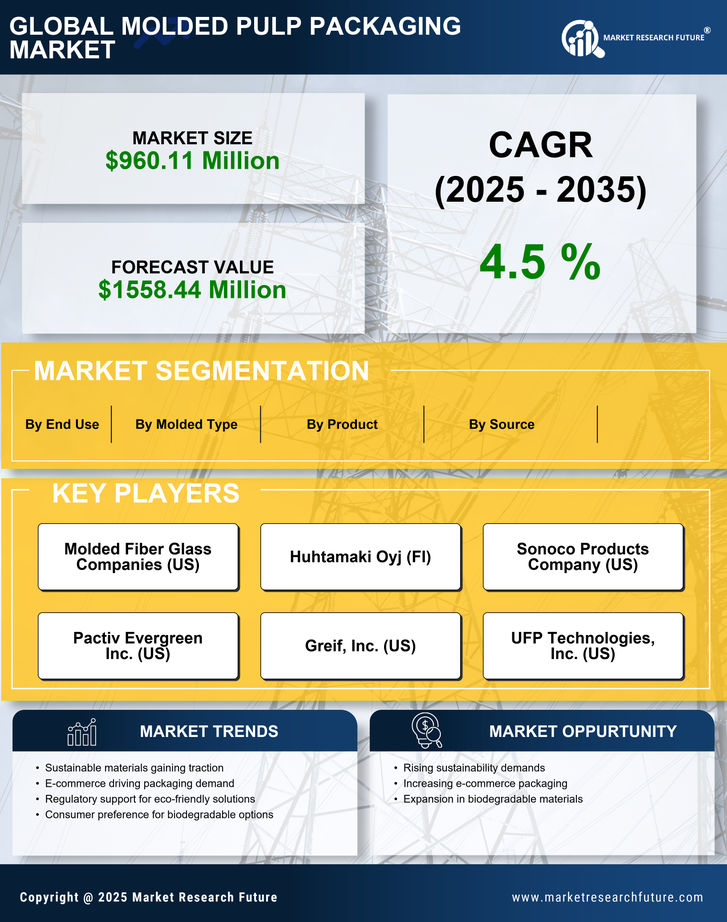
Request Free Sample ×

Kindly complete the form below to receive a free sample of this Report

* Please use a valid business email

Leading companies partner with us for data-driven Insights

clients tt-cursor
Hero Background

US Molded Pulp Packaging Market

ID: MRFR/PCM/18964-HCR
111 Pages
Snehal Singh
Last Updated: April 06, 2026

US Molded Pulp Packaging Market Research Report: By Molded Type (Thick Wall, Transfer Molded, Thermoformed Fiber, Processed Pulp), By Source (Wood pulp, Non wood pulp), By Product (Food, Trays, Clamshells, Cups, Plates, Bowls, Others) and By End Use (Food Service Disposables, Food Packaging, Healthcare, Electronics, Others) - Forecast to 2035

Share:
Download PDF ×

We do not share your information with anyone. However, we may send you emails based on your report interest from time to time. You may contact us at any time to opt-out.

US Molded Pulp Packaging Market Infographic
Purchase Options
  1. 1 SECTION I: EXECUTIVE SUMMARY AND KEY HIGHLIGHTS
  2.   1.1 EXECUTIVE SUMMARY
  3.     1.1.1 Market Overview
  4.     1.1.2 Key Findings
  5.     1.1.3 Market Segmentation
  6.     1.1.4 Competitive Landscape
  7.     1.1.5 Challenges and Opportunities
  8.     1.1.6 Future Outlook
  9. 2 SECTION II: SCOPING, METHODOLOGY AND MARKET STRUCTURE
  10.   2.1 MARKET INTRODUCTION
  11.     2.1.1 Definition
  12.     2.1.2 Scope of the study
  13.       2.1.2.1 Research Objective
  14.       2.1.2.2 Assumption
  15.       2.1.2.3 Limitations
  16.   2.2 RESEARCH METHODOLOGY
  17.     2.2.1 Overview
  18.     2.2.2 Data Mining
  19.     2.2.3 Secondary Research
  20.     2.2.4 Primary Research
  21.       2.2.4.1 Primary Interviews and Information Gathering Process
  22.       2.2.4.2 Breakdown of Primary Respondents
  23.     2.2.5 Forecasting Model
  24.     2.2.6 Market Size Estimation
  25.       2.2.6.1 Bottom-Up Approach
  26.       2.2.6.2 Top-Down Approach
  27.     2.2.7 Data Triangulation
  28.     2.2.8 Validation
  29. 3 SECTION III: QUALITATIVE ANALYSIS
  30.   3.1 MARKET DYNAMICS
  31.     3.1.1 Overview
  32.     3.1.2 Drivers
  33.     3.1.3 Restraints
  34.     3.1.4 Opportunities
  35.   3.2 MARKET FACTOR ANALYSIS
  36.     3.2.1 Value chain Analysis
  37.     3.2.2 Porter's Five Forces Analysis
  38.       3.2.2.1 Bargaining Power of Suppliers
  39.       3.2.2.2 Bargaining Power of Buyers
  40.       3.2.2.3 Threat of New Entrants
  41.       3.2.2.4 Threat of Substitutes
  42.       3.2.2.5 Intensity of Rivalry
  43.     3.2.3 COVID-19 Impact Analysis
  44.       3.2.3.1 Market Impact Analysis
  45.       3.2.3.2 Regional Impact
  46.       3.2.3.3 Opportunity and Threat Analysis
  47. 4 SECTION IV: QUANTITATIVE ANALYSIS
  48.   4.1 Packaging & Transport, BY Molded Type (USD Million)
  49.     4.1.1 Thick Wall
  50.     4.1.2 Transfer Molded
  51.     4.1.3 Thermoformed Fiber
  52.     4.1.4 Processed Pulp
  53.   4.2 Packaging & Transport, BY Source (USD Million)
  54.     4.2.1 Wood Pulp
  55.     4.2.2 Non Wood Pulp
  56.   4.3 Packaging & Transport, BY Product (USD Million)
  57.     4.3.1 Food
  58.     4.3.2 Trays
  59.     4.3.3 Clamshells
  60.     4.3.4 Cups
  61.     4.3.5 Plates
  62.     4.3.6 Bowls
  63.     4.3.7 Others
  64.   4.4 Packaging & Transport, BY End Use (USD Million)
  65.     4.4.1 Food Service Disposables
  66.     4.4.2 Food Packaging
  67.     4.4.3 Healthcare
  68.     4.4.4 Electronics
  69.     4.4.5 Others
  70. 5 SECTION V: COMPETITIVE ANALYSIS
  71.   5.1 Competitive Landscape
  72.     5.1.1 Overview
  73.     5.1.2 Competitive Analysis
  74.     5.1.3 Market share Analysis
  75.     5.1.4 Major Growth Strategy in the Packaging & Transport
  76.     5.1.5 Competitive Benchmarking
  77.     5.1.6 Leading Players in Terms of Number of Developments in the Packaging & Transport
  78.     5.1.7 Key developments and growth strategies
  79.       5.1.7.1 New Product Launch/Service Deployment
  80.       5.1.7.2 Merger & Acquisitions
  81.       5.1.7.3 Joint Ventures
  82.     5.1.8 Major Players Financial Matrix
  83.       5.1.8.1 Sales and Operating Income
  84.       5.1.8.2 Major Players R&D Expenditure. 2023
  85.   5.2 Company Profiles
  86.     5.2.1 Molded Fiber Glass Companies (US)
  87.       5.2.1.1 Financial Overview
  88.       5.2.1.2 Products Offered
  89.       5.2.1.3 Key Developments
  90.       5.2.1.4 SWOT Analysis
  91.       5.2.1.5 Key Strategies
  92.     5.2.2 Huhtamaki Oyj (FI)
  93.       5.2.2.1 Financial Overview
  94.       5.2.2.2 Products Offered
  95.       5.2.2.3 Key Developments
  96.       5.2.2.4 SWOT Analysis
  97.       5.2.2.5 Key Strategies
  98.     5.2.3 Sonoco Products Company (US)
  99.       5.2.3.1 Financial Overview
  100.       5.2.3.2 Products Offered
  101.       5.2.3.3 Key Developments
  102.       5.2.3.4 SWOT Analysis
  103.       5.2.3.5 Key Strategies
  104.     5.2.4 Pactiv Evergreen Inc. (US)
  105.       5.2.4.1 Financial Overview
  106.       5.2.4.2 Products Offered
  107.       5.2.4.3 Key Developments
  108.       5.2.4.4 SWOT Analysis
  109.       5.2.4.5 Key Strategies
  110.     5.2.5 Greif, Inc. (US)
  111.       5.2.5.1 Financial Overview
  112.       5.2.5.2 Products Offered
  113.       5.2.5.3 Key Developments
  114.       5.2.5.4 SWOT Analysis
  115.       5.2.5.5 Key Strategies
  116.     5.2.6 UFP Technologies, Inc. (US)
  117.       5.2.6.1 Financial Overview
  118.       5.2.6.2 Products Offered
  119.       5.2.6.3 Key Developments
  120.       5.2.6.4 SWOT Analysis
  121.       5.2.6.5 Key Strategies
  122.     5.2.7 Cascades Inc. (CA)
  123.       5.2.7.1 Financial Overview
  124.       5.2.7.2 Products Offered
  125.       5.2.7.3 Key Developments
  126.       5.2.7.4 SWOT Analysis
  127.       5.2.7.5 Key Strategies
  128.     5.2.8 Smurfit Kappa Group (IE)
  129.       5.2.8.1 Financial Overview
  130.       5.2.8.2 Products Offered
  131.       5.2.8.3 Key Developments
  132.       5.2.8.4 SWOT Analysis
  133.       5.2.8.5 Key Strategies
  134.     5.2.9 WestRock Company (US)
  135.       5.2.9.1 Financial Overview
  136.       5.2.9.2 Products Offered
  137.       5.2.9.3 Key Developments
  138.       5.2.9.4 SWOT Analysis
  139.       5.2.9.5 Key Strategies
  140.   5.3 Appendix
  141.     5.3.1 References
  142.     5.3.2 Related Reports
  143. 6 LIST OF FIGURES
  144.   6.1 MARKET SYNOPSIS
  145.   6.2 US MARKET ANALYSIS BY MOLDED TYPE
  146.   6.3 US MARKET ANALYSIS BY SOURCE
  147.   6.4 US MARKET ANALYSIS BY PRODUCT
  148.   6.5 US MARKET ANALYSIS BY END USE
  149.   6.6 KEY BUYING CRITERIA OF PACKAGING & TRANSPORT
  150.   6.7 RESEARCH PROCESS OF MRFR
  151.   6.8 DRO ANALYSIS OF PACKAGING & TRANSPORT
  152.   6.9 DRIVERS IMPACT ANALYSIS: PACKAGING & TRANSPORT
  153.   6.10 RESTRAINTS IMPACT ANALYSIS: PACKAGING & TRANSPORT
  154.   6.11 SUPPLY / VALUE CHAIN: PACKAGING & TRANSPORT
  155.   6.12 PACKAGING & TRANSPORT, BY MOLDED TYPE, 2024 (% SHARE)
  156.   6.13 PACKAGING & TRANSPORT, BY MOLDED TYPE, 2024 TO 2035 (USD Million)
  157.   6.14 PACKAGING & TRANSPORT, BY SOURCE, 2024 (% SHARE)
  158.   6.15 PACKAGING & TRANSPORT, BY SOURCE, 2024 TO 2035 (USD Million)
  159.   6.16 PACKAGING & TRANSPORT, BY PRODUCT, 2024 (% SHARE)
  160.   6.17 PACKAGING & TRANSPORT, BY PRODUCT, 2024 TO 2035 (USD Million)
  161.   6.18 PACKAGING & TRANSPORT, BY END USE, 2024 (% SHARE)
  162.   6.19 PACKAGING & TRANSPORT, BY END USE, 2024 TO 2035 (USD Million)
  163.   6.20 BENCHMARKING OF MAJOR COMPETITORS
  164. 7 LIST OF TABLES
  165.   7.1 LIST OF ASSUMPTIONS
  166.     7.1.1
  167.   7.2 US MARKET SIZE ESTIMATES; FORECAST
  168.     7.2.1 BY MOLDED TYPE, 2025-2035 (USD Million)
  169.     7.2.2 BY SOURCE, 2025-2035 (USD Million)
  170.     7.2.3 BY PRODUCT, 2025-2035 (USD Million)
  171.     7.2.4 BY END USE, 2025-2035 (USD Million)
  172.   7.3 PRODUCT LAUNCH/PRODUCT DEVELOPMENT/APPROVAL
  173.     7.3.1
  174.   7.4 ACQUISITION/PARTNERSHIP
  175.     7.4.1

US Packaging & Transport Market Segmentation

Packaging & Transport By Molded Type (USD Million, 2025-2035)

  • Thick Wall
  • Transfer Molded
  • Thermoformed Fiber
  • Processed Pulp

Packaging & Transport By Source (USD Million, 2025-2035)

  • Wood Pulp
  • Non Wood Pulp

Packaging & Transport By Product (USD Million, 2025-2035)

  • Food
  • Trays
  • Clamshells
  • Cups
  • Plates
  • Bowls
  • Others

Packaging & Transport By End Use (USD Million, 2025-2035)

  • Food Service Disposables
  • Food Packaging
  • Healthcare
  • Electronics
  • Others

Compare Licence

×
Features License Type
Single User Multiuser License Enterprise User
Price $4,950 $5,950 $7,250
Maximum User Access Limit 1 User Upto 10 Users Unrestricted Access Throughout the Organization
Free Customization
Direct Access to Analyst
Deliverable Format
Platform Access
Discount on Next Purchase 10% 15% 15%
Printable Versions