US MCHP Market

ID: MRFR/EnP/11848-HCR
100 Pages
Garvit Vyas
Last Updated: June 19, 2026
US MCHP Market Research Report By Technology (Internal Combustion Engine, Stirling Engine, Fuel Cell), By Fuel Type (Natural Gas, Biogas, Propane, Renewable Energy), By Application (Residential, Commercial, Industrial) and By End Use (Heating, Electricity Generation, Combined Heating and Power) - Forecast to 2035
Download PDF ×

We do not share your information with anyone. However, we may send you emails based on your report interest from time to time. You may contact us at any time to opt-out.

US MCHP Market

Market Size

Forecast Period2025 - 2035
CAGR (2025 - 2035)8.32%
2024 Market Size$ 618.07 Million
2025 Market Size$ 669.5 Million
2035 Market Size$ 1,488.8 Million

Key Players

Microchip Technology Inc
Texas Instruments Inc
NXP Semiconductors NV
STMicroelectronics NV
Infineon Technologies AG
Analog Devices Inc
Opportunities
  • Supply Chain Resilience
  • Consumer Demand for Customization
  • Regulatory Compliance and Standards
  1. SECTION I: EXECUTIVE SUMMARY AND KEY HIGHLIGHTS |
    1. 1.1 EXECUTIVE SUMMARY | |
      1. 1.1.1 Market Overview | |
      2. 1.1.2 Key Findings | |
      3. 1.1.3 Market Segmentation | |
      4. 1.1.4 Competitive Landscape | |
      5. 1.1.5 Challenges and Opportunities | |
      6. 1.1.6 Future Outlook 2
  2. SECTION II: SCOPING, METHODOLOGY AND MARKET STRUCTURE |
    1. 2.1 MARKET INTRODUCTION | |
      1. 2.1.1 Definition | |
      2. 2.1.2 Scope of the study | | |
        1. 2.1.2.1 Research Objective | | |
        2. 2.1.2.2 Assumption | | |
        3. 2.1.2.3 Limitations |
    2. 2.2 RESEARCH METHODOLOGY | |
      1. 2.2.1 Overview | |
      2. 2.2.2 Data Mining | |
      3. 2.2.3 Secondary Research | |
      4. 2.2.4 Primary Research | | |
        1. 2.2.4.1 Primary Interviews and Information Gathering Process | | |
        2. 2.2.4.2 Breakdown of Primary Respondents | |
      5. 2.2.5 Forecasting Model | |
      6. 2.2.6 Market Size Estimation | | |
        1. 2.2.6.1 Bottom-Up Approach | | |
        2. 2.2.6.2 Top-Down Approach | |
      7. 2.2.7 Data Triangulation | |
      8. 2.2.8 Validation 3
  3. SECTION III: QUALITATIVE ANALYSIS |
    1. 3.1 MARKET DYNAMICS | |
      1. 3.1.1 Overview | |
      2. 3.1.2 Drivers | |
      3. 3.1.3 Restraints | |
      4. 3.1.4 Opportunities |
    2. 3.2 MARKET FACTOR ANALYSIS | |
      1. 3.2.1 Value chain Analysis | |
      2. 3.2.2 Porter's Five Forces Analysis | | |
        1. 3.2.2.1 Bargaining Power of Suppliers | | |
        2. 3.2.2.2 Bargaining Power of Buyers | | |
        3. 3.2.2.3 Threat of New Entrants | | |
        4. 3.2.2.4 Threat of Substitutes | | |
        5. 3.2.2.5 Intensity of Rivalry | |
      3. 3.2.3 COVID-19 Impact Analysis | | |
        1. 3.2.3.1 Market Impact Analysis | | |
        2. 3.2.3.2 Regional Impact | | |
        3. 3.2.3.3 Opportunity and Threat Analysis 4
  4. SECTION IV: QUANTITATIVE ANALYSIS |
    1. 4.1 Healthcare, BY Technology (USD Million) | |
      1. 4.1.1 Internal Combustion Engine | |
      2. 4.1.2 Stirling Engine | |
      3. 4.1.3 Fuel Cell |
    2. 4.2 Healthcare, BY Fuel Type (USD Million) | |
      1. 4.2.1 Natural Gas | |
      2. 4.2.2 Biogas | |
      3. 4.2.3 Propane | |
      4. 4.2.4 Renewable Energy |
    3. 4.3 Healthcare, BY Application (USD Million) | |
      1. 4.3.1 Residential | |
      2. 4.3.2 Commercial | |
      3. 4.3.3 Industrial |
    4. 4.4 Healthcare, BY End Use (USD Million) | |
      1. 4.4.1 Heating | |
      2. 4.4.2 Electricity Generation | |
      3. 4.4.3 Combined Heating and Power 5
  5. SECTION V: COMPETITIVE ANALYSIS |
    1. 5.1 Competitive Landscape | |
      1. 5.1.1 Overview | |
      2. 5.1.2 Competitive Analysis | |
      3. 5.1.3 Market share Analysis | |
      4. 5.1.4 Major Growth Strategy in the Healthcare | |
      5. 5.1.5 Competitive Benchmarking | |
      6. 5.1.6 Leading Players in Terms of Number of Developments in the Healthcare | |
      7. 5.1.7 Key developments and growth strategies | | |
        1. 5.1.7.1 New Product Launch/Service Deployment | | |
        2. 5.1.7.2 Merger & Acquisitions | | |
        3. 5.1.7.3 Joint Ventures | |
      8. 5.1.8 Major Players Financial Matrix | | |
        1. 5.1.8.1 Sales and Operating Income | | |
        2. 5.1.8.2 Major Players R&D Expenditure. 2023 |
    2. 5.2 Company Profiles | |
      1. 5.2.1 Microchip Technology Inc (US) | | |
        1. 5.2.1.1 Financial Overview | | |
        2. 5.2.1.2 Products Offered | | |
        3. 5.2.1.3 Key Developments | | |
        4. 5.2.1.4 SWOT Analysis | | |
        5. 5.2.1.5 Key Strategies | |
      2. 5.2.2 Texas Instruments Inc (US) | | |
        1. 5.2.2.1 Financial Overview | | |
        2. 5.2.2.2 Products Offered | | |
        3. 5.2.2.3 Key Developments | | |
        4. 5.2.2.4 SWOT Analysis | | |
        5. 5.2.2.5 Key Strategies | |
      3. 5.2.3 NXP Semiconductors NV (NL) | | |
        1. 5.2.3.1 Financial Overview | | |
        2. 5.2.3.2 Products Offered | | |
        3. 5.2.3.3 Key Developments | | |
        4. 5.2.3.4 SWOT Analysis | | |
        5. 5.2.3.5 Key Strategies | |
      4. 5.2.4 STMicroelectronics NV (CH) | | |
        1. 5.2.4.1 Financial Overview | | |
        2. 5.2.4.2 Products Offered | | |
        3. 5.2.4.3 Key Developments | | |
        4. 5.2.4.4 SWOT Analysis | | |
        5. 5.2.4.5 Key Strategies | |
      5. 5.2.5 Infineon Technologies AG (DE) | | |
        1. 5.2.5.1 Financial Overview | | |
        2. 5.2.5.2 Products Offered | | |
        3. 5.2.5.3 Key Developments | | |
        4. 5.2.5.4 SWOT Analysis | | |
        5. 5.2.5.5 Key Strategies | |
      6. 5.2.6 Analog Devices Inc (US) | | |
        1. 5.2.6.1 Financial Overview | | |
        2. 5.2.6.2 Products Offered | | |
        3. 5.2.6.3 Key Developments | | |
        4. 5.2.6.4 SWOT Analysis | | |
        5. 5.2.6.5 Key Strategies | |
      7. 5.2.7 ON Semiconductor Corp (US) | | |
        1. 5.2.7.1 Financial Overview | | |
        2. 5.2.7.2 Products Offered | | |
        3. 5.2.7.3 Key Developments | | |
        4. 5.2.7.4 SWOT Analysis | | |
        5. 5.2.7.5 Key Strategies | |
      8. 5.2.8 Maxim Integrated Products Inc (US) | | |
        1. 5.2.8.1 Financial Overview | | |
        2. 5.2.8.2 Products Offered | | |
        3. 5.2.8.3 Key Developments | | |
        4. 5.2.8.4 SWOT Analysis | | |
        5. 5.2.8.5 Key Strategies |
    3. 5.3 Appendix | |
      1. 5.3.1 References | |
      2. 5.3.2 Related Reports 6 LIST OF FIGURES |
    4. 6.1 MARKET SYNOPSIS |
    5. 6.2 US MARKET ANALYSIS BY TECHNOLOGY |
    6. 6.3 US MARKET ANALYSIS BY FUEL TYPE |
    7. 6.4 US MARKET ANALYSIS BY APPLICATION |
    8. 6.5 US MARKET ANALYSIS BY END USE |
    9. 6.6 KEY BUYING CRITERIA OF HEALTHCARE |
    10. 6.7 RESEARCH PROCESS OF MRFR |
    11. 6.8 DRO ANALYSIS OF HEALTHCARE |
    12. 6.9 DRIVERS IMPACT ANALYSIS: HEALTHCARE |
    13. 6.10 RESTRAINTS IMPACT ANALYSIS: HEALTHCARE |
    14. 6.11 SUPPLY / VALUE CHAIN: HEALTHCARE |
    15. 6.12 HEALTHCARE, BY TECHNOLOGY, 2024 (% SHARE) |
    16. 6.13 HEALTHCARE, BY TECHNOLOGY, 2024 TO 2035 (USD Million) |
    17. 6.14 HEALTHCARE, BY FUEL TYPE, 2024 (% SHARE) |
    18. 6.15 HEALTHCARE, BY FUEL TYPE, 2024 TO 2035 (USD Million) |
    19. 6.16 HEALTHCARE, BY APPLICATION, 2024 (% SHARE) |
    20. 6.17 HEALTHCARE, BY APPLICATION, 2024 TO 2035 (USD Million) |
    21. 6.18 HEALTHCARE, BY END USE, 2024 (% SHARE) |
    22. 6.19 HEALTHCARE, BY END USE, 2024 TO 2035 (USD Million) |
    23. 6.20 BENCHMARKING OF MAJOR COMPETITORS 7 LIST OF TABLES |
    24. 7.1 LIST OF ASSUMPTIONS | |
      1. 7.1.1 |
    25. 7.2 US MARKET SIZE ESTIMATES; FORECAST | |
      1. 7.2.1 BY TECHNOLOGY, 2025-2035 (USD Million) | |
      2. 7.2.2 BY FUEL TYPE, 2025-2035 (USD Million) | |
      3. 7.2.3 BY APPLICATION, 2025-2035 (USD Million) | |
      4. 7.2.4 BY END USE, 2025-2035 (USD Million) |
    26. 7.3 PRODUCT LAUNCH/PRODUCT DEVELOPMENT/APPROVAL | |
      1. 7.3.1 |
    27. 7.4 ACQUISITION/PARTNERSHIP | |

US Healthcare Market Segmentation

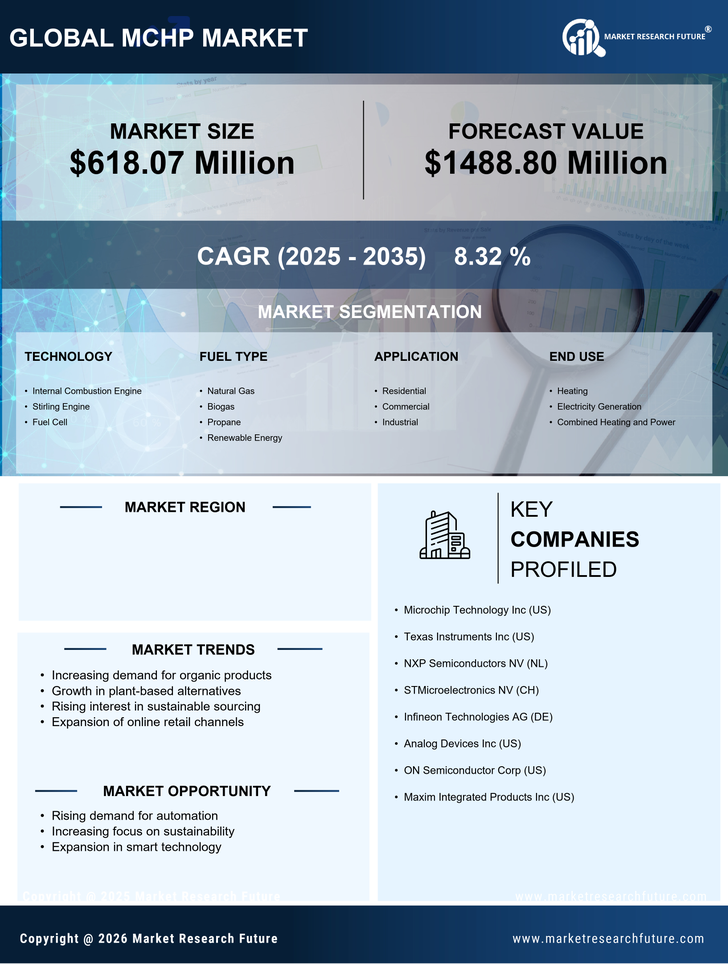
Healthcare By Technology (USD Million, 2025-2035)

  • Internal Combustion Engine
  • Stirling Engine
  • Fuel Cell

Healthcare By Fuel Type (USD Million, 2025-2035)

  • Natural Gas
  • Biogas
  • Propane
  • Renewable Energy

Healthcare By Application (USD Million, 2025-2035)

  • Residential
  • Commercial
  • Industrial

Healthcare By End Use (USD Million, 2025-2035)

  • Heating
  • Electricity Generation
  • Combined Heating and Power