Request Free Sample ×

Kindly complete the form below to receive a free sample of this Report

* Please use a valid business email

Leading companies partner with us for data-driven Insights

clients tt-cursor
Hero Background

US Light olefin market

ID: MRFR/CnM/13193-HCR
100 Pages
Garvit Vyas
Last Updated: April 06, 2026

US Light Olefin Market Research Report By Application (Refinery, Chemical Commodities), By Derivatives (Propylene Oxide, Cumene, Acetate Monomer, Oxo Alcohols, Ethylene Oxide, EDC/VCM/PVC, Alpha-Olefins, Polypropylene, Acrylonitrile, Acrylic Acid, Polyethylene, Glycol, Styrene), By Product Type (Propylene, Butadiene, Ethylene, Butylene, Others), By Distribution Channel (Distributors, Wholesaler) - Forecast to 2035

Share:
Download PDF ×

We do not share your information with anyone. However, we may send you emails based on your report interest from time to time. You may contact us at any time to opt-out.

US Light olefin market Infographic
Purchase Options
  1. 1 SECTION I: EXECUTIVE SUMMARY AND KEY HIGHLIGHTS
  2.   1.1 EXECUTIVE SUMMARY
  3.     1.1.1 Market Overview
  4.     1.1.2 Key Findings
  5.     1.1.3 Market Segmentation
  6.     1.1.4 Competitive Landscape
  7.     1.1.5 Challenges and Opportunities
  8.     1.1.6 Future Outlook
  9. 2 SECTION II: SCOPING, METHODOLOGY AND MARKET STRUCTURE
  10.   2.1 MARKET INTRODUCTION
  11.     2.1.1 Definition
  12.     2.1.2 Scope of the study
  13.       2.1.2.1 Research Objective
  14.       2.1.2.2 Assumption
  15.       2.1.2.3 Limitations
  16.   2.2 RESEARCH METHODOLOGY
  17.     2.2.1 Overview
  18.     2.2.2 Data Mining
  19.     2.2.3 Secondary Research
  20.     2.2.4 Primary Research
  21.       2.2.4.1 Primary Interviews and Information Gathering Process
  22.       2.2.4.2 Breakdown of Primary Respondents
  23.     2.2.5 Forecasting Model
  24.     2.2.6 Market Size Estimation
  25.       2.2.6.1 Bottom-Up Approach
  26.       2.2.6.2 Top-Down Approach
  27.     2.2.7 Data Triangulation
  28.     2.2.8 Validation
  29. 3 SECTION III: QUALITATIVE ANALYSIS
  30.   3.1 MARKET DYNAMICS
  31.     3.1.1 Overview
  32.     3.1.2 Drivers
  33.     3.1.3 Restraints
  34.     3.1.4 Opportunities
  35.   3.2 MARKET FACTOR ANALYSIS
  36.     3.2.1 Value chain Analysis
  37.     3.2.2 Porter's Five Forces Analysis
  38.       3.2.2.1 Bargaining Power of Suppliers
  39.       3.2.2.2 Bargaining Power of Buyers
  40.       3.2.2.3 Threat of New Entrants
  41.       3.2.2.4 Threat of Substitutes
  42.       3.2.2.5 Intensity of Rivalry
  43.     3.2.3 COVID-19 Impact Analysis
  44.       3.2.3.1 Market Impact Analysis
  45.       3.2.3.2 Regional Impact
  46.       3.2.3.3 Opportunity and Threat Analysis
  47. 4 SECTION IV: QUANTITATIVE ANALYSIS
  48.   4.1 Security, Access Control and Robotics, BY Product Type (USD Million)
  49.     4.1.1 propylene
  50.     4.1.2 Butadiene
  51.     4.1.3 ethylene
  52.     4.1.4 Butylene
  53.     4.1.5 others
  54.   4.2 Security, Access Control and Robotics, BY Derivatives (USD Million)
  55.     4.2.1 propylene oxide
  56.     4.2.2 cumene
  57.     4.2.3 acetate monomer
  58.     4.2.4 oxo alcohols
  59.     4.2.5 ethylene oxide
  60.     4.2.6 EDC/ VCM/ PVC
  61.     4.2.7 alpha-olefins
  62.     4.2.8 polypropylene
  63.     4.2.9 acrylonitrile
  64.     4.2.10 acrylic acid
  65.     4.2.11 polyethylene
  66.     4.2.12 glycol
  67.     4.2.13 styrene
  68.   4.3 Security, Access Control and Robotics, BY Application (USD Million)
  69.     4.3.1 refinery
  70.     4.3.2 chemical commodities
  71.   4.4 Security, Access Control and Robotics, BY Distribution Channel (USD Million)
  72.     4.4.1 Distributors
  73.     4.4.2 Wholesaler
  74. 5 SECTION V: COMPETITIVE ANALYSIS
  75.   5.1 Competitive Landscape
  76.     5.1.1 Overview
  77.     5.1.2 Competitive Analysis
  78.     5.1.3 Market share Analysis
  79.     5.1.4 Major Growth Strategy in the Security, Access Control and Robotics
  80.     5.1.5 Competitive Benchmarking
  81.     5.1.6 Leading Players in Terms of Number of Developments in the Security, Access Control and Robotics
  82.     5.1.7 Key developments and growth strategies
  83.       5.1.7.1 New Product Launch/Service Deployment
  84.       5.1.7.2 Merger & Acquisitions
  85.       5.1.7.3 Joint Ventures
  86.     5.1.8 Major Players Financial Matrix
  87.       5.1.8.1 Sales and Operating Income
  88.       5.1.8.2 Major Players R&D Expenditure. 2023
  89.   5.2 Company Profiles
  90.     5.2.1 SABIC (SA)
  91.       5.2.1.1 Financial Overview
  92.       5.2.1.2 Products Offered
  93.       5.2.1.3 Key Developments
  94.       5.2.1.4 SWOT Analysis
  95.       5.2.1.5 Key Strategies
  96.     5.2.2 ExxonMobil (US)
  97.       5.2.2.1 Financial Overview
  98.       5.2.2.2 Products Offered
  99.       5.2.2.3 Key Developments
  100.       5.2.2.4 SWOT Analysis
  101.       5.2.2.5 Key Strategies
  102.     5.2.3 LyondellBasell (US)
  103.       5.2.3.1 Financial Overview
  104.       5.2.3.2 Products Offered
  105.       5.2.3.3 Key Developments
  106.       5.2.3.4 SWOT Analysis
  107.       5.2.3.5 Key Strategies
  108.     5.2.4 Dow (US)
  109.       5.2.4.1 Financial Overview
  110.       5.2.4.2 Products Offered
  111.       5.2.4.3 Key Developments
  112.       5.2.4.4 SWOT Analysis
  113.       5.2.4.5 Key Strategies
  114.     5.2.5 Ineos (GB)
  115.       5.2.5.1 Financial Overview
  116.       5.2.5.2 Products Offered
  117.       5.2.5.3 Key Developments
  118.       5.2.5.4 SWOT Analysis
  119.       5.2.5.5 Key Strategies
  120.     5.2.6 Shell (NL)
  121.       5.2.6.1 Financial Overview
  122.       5.2.6.2 Products Offered
  123.       5.2.6.3 Key Developments
  124.       5.2.6.4 SWOT Analysis
  125.       5.2.6.5 Key Strategies
  126.     5.2.7 Chevron Phillips Chemical (US)
  127.       5.2.7.1 Financial Overview
  128.       5.2.7.2 Products Offered
  129.       5.2.7.3 Key Developments
  130.       5.2.7.4 SWOT Analysis
  131.       5.2.7.5 Key Strategies
  132.     5.2.8 Mitsubishi Chemical (JP)
  133.       5.2.8.1 Financial Overview
  134.       5.2.8.2 Products Offered
  135.       5.2.8.3 Key Developments
  136.       5.2.8.4 SWOT Analysis
  137.       5.2.8.5 Key Strategies
  138.     5.2.9 Braskem (BR)
  139.       5.2.9.1 Financial Overview
  140.       5.2.9.2 Products Offered
  141.       5.2.9.3 Key Developments
  142.       5.2.9.4 SWOT Analysis
  143.       5.2.9.5 Key Strategies
  144.   5.3 Appendix
  145.     5.3.1 References
  146.     5.3.2 Related Reports
  147. 6 LIST OF FIGURES
  148.   6.1 MARKET SYNOPSIS
  149.   6.2 US MARKET ANALYSIS BY PRODUCT TYPE
  150.   6.3 US MARKET ANALYSIS BY DERIVATIVES
  151.   6.4 US MARKET ANALYSIS BY APPLICATION
  152.   6.5 US MARKET ANALYSIS BY DISTRIBUTION CHANNEL
  153.   6.6 KEY BUYING CRITERIA OF SECURITY, ACCESS CONTROL AND ROBOTICS
  154.   6.7 RESEARCH PROCESS OF MRFR
  155.   6.8 DRO ANALYSIS OF SECURITY, ACCESS CONTROL AND ROBOTICS
  156.   6.9 DRIVERS IMPACT ANALYSIS: SECURITY, ACCESS CONTROL AND ROBOTICS
  157.   6.10 RESTRAINTS IMPACT ANALYSIS: SECURITY, ACCESS CONTROL AND ROBOTICS
  158.   6.11 SUPPLY / VALUE CHAIN: SECURITY, ACCESS CONTROL AND ROBOTICS
  159.   6.12 SECURITY, ACCESS CONTROL AND ROBOTICS, BY PRODUCT TYPE, 2024 (% SHARE)
  160.   6.13 SECURITY, ACCESS CONTROL AND ROBOTICS, BY PRODUCT TYPE, 2024 TO 2035 (USD Million)
  161.   6.14 SECURITY, ACCESS CONTROL AND ROBOTICS, BY DERIVATIVES, 2024 (% SHARE)
  162.   6.15 SECURITY, ACCESS CONTROL AND ROBOTICS, BY DERIVATIVES, 2024 TO 2035 (USD Million)
  163.   6.16 SECURITY, ACCESS CONTROL AND ROBOTICS, BY APPLICATION, 2024 (% SHARE)
  164.   6.17 SECURITY, ACCESS CONTROL AND ROBOTICS, BY APPLICATION, 2024 TO 2035 (USD Million)
  165.   6.18 SECURITY, ACCESS CONTROL AND ROBOTICS, BY DISTRIBUTION CHANNEL, 2024 (% SHARE)
  166.   6.19 SECURITY, ACCESS CONTROL AND ROBOTICS, BY DISTRIBUTION CHANNEL, 2024 TO 2035 (USD Million)
  167.   6.20 BENCHMARKING OF MAJOR COMPETITORS
  168. 7 LIST OF TABLES
  169.   7.1 LIST OF ASSUMPTIONS
  170.     7.1.1
  171.   7.2 US MARKET SIZE ESTIMATES; FORECAST
  172.     7.2.1 BY PRODUCT TYPE, 2025-2035 (USD Million)
  173.     7.2.2 BY DERIVATIVES, 2025-2035 (USD Million)
  174.     7.2.3 BY APPLICATION, 2025-2035 (USD Million)
  175.     7.2.4 BY DISTRIBUTION CHANNEL, 2025-2035 (USD Million)
  176.   7.3 PRODUCT LAUNCH/PRODUCT DEVELOPMENT/APPROVAL
  177.     7.3.1
  178.   7.4 ACQUISITION/PARTNERSHIP
  179.     7.4.1

US Security, Access Control and Robotics Market Segmentation

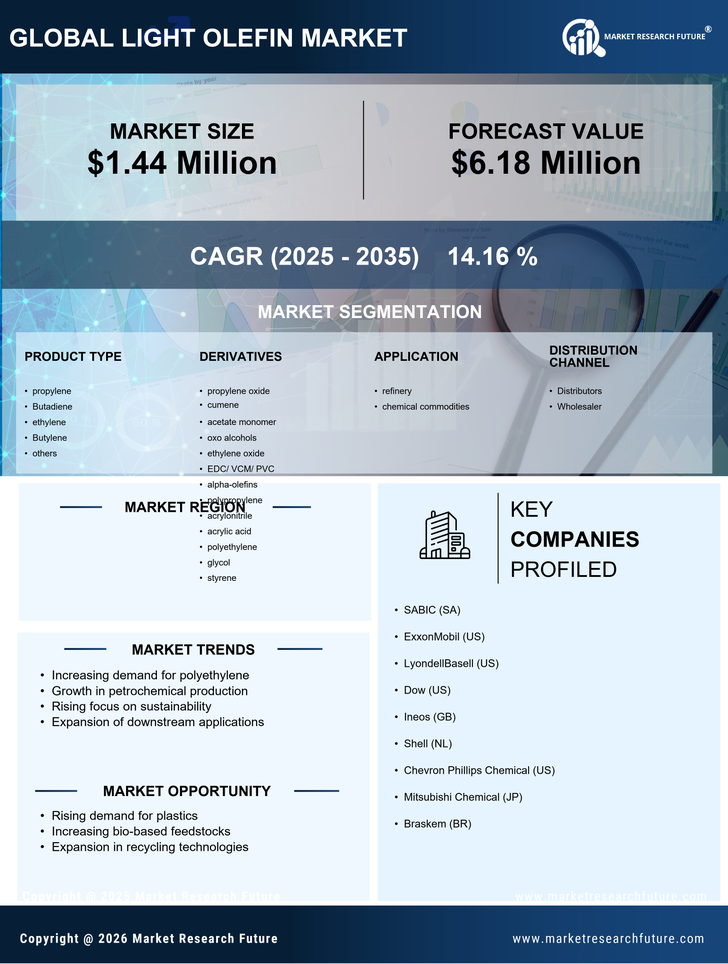
Security, Access Control and Robotics By Product Type (USD Million, 2025-2035)

  • propylene
  • Butadiene
  • ethylene
  • Butylene
  • others

Security, Access Control and Robotics By Derivatives (USD Million, 2025-2035)

  • propylene oxide
  • cumene
  • acetate monomer
  • oxo alcohols
  • ethylene oxide
  • EDC/ VCM/ PVC
  • alpha-olefins
  • polypropylene
  • acrylonitrile
  • acrylic acid
  • polyethylene
  • glycol
  • styrene

Security, Access Control and Robotics By Application (USD Million, 2025-2035)

  • refinery
  • chemical commodities

Security, Access Control and Robotics By Distribution Channel (USD Million, 2025-2035)

  • Distributors
  • Wholesaler

Compare Licence

×
Features License Type
Single User Multiuser License Enterprise User
Price $4,950 $5,950 $7,250
Maximum User Access Limit 1 User Upto 10 Users Unrestricted Access Throughout the Organization
Free Customization
Direct Access to Analyst
Deliverable Format
Platform Access
Discount on Next Purchase 10% 15% 15%
Printable Versions