Request Free Sample ×

Kindly complete the form below to receive a free sample of this Report

* Please use a valid business email

Leading companies partner with us for data-driven Insights

clients tt-cursor
Hero Background

US Lemonade Market

ID: MRFR/FnB/19655-HCR
200 Pages
Snehal Singh
Last Updated: April 06, 2026

US Lemonade Market Size, Share, Industry Trend & Analysis Research Report: By Product Type (Cloudy, Clear), By Category (Flavored, Plain), By Packaging (Bottles, Pouches, Cans, Others) andBy Distribution Channel (Store-based, Non-store-based)- Forecast to 2035

Share:
Download PDF ×

We do not share your information with anyone. However, we may send you emails based on your report interest from time to time. You may contact us at any time to opt-out.

US Lemonade Market Infographic
Purchase Options
  1. 1 SECTION I: EXECUTIVE SUMMARY AND KEY HIGHLIGHTS
  2.   1.1 EXECUTIVE SUMMARY
  3.     1.1.1 Market Overview
  4.     1.1.2 Key Findings
  5.     1.1.3 Market Segmentation
  6.     1.1.4 Competitive Landscape
  7.     1.1.5 Challenges and Opportunities
  8.     1.1.6 Future Outlook
  9. 2 SECTION II: SCOPING, METHODOLOGY AND MARKET STRUCTURE
  10.   2.1 MARKET INTRODUCTION
  11.     2.1.1 Definition
  12.     2.1.2 Scope of the study
  13.       2.1.2.1 Research Objective
  14.       2.1.2.2 Assumption
  15.       2.1.2.3 Limitations
  16.   2.2 RESEARCH METHODOLOGY
  17.     2.2.1 Overview
  18.     2.2.2 Data Mining
  19.     2.2.3 Secondary Research
  20.     2.2.4 Primary Research
  21.       2.2.4.1 Primary Interviews and Information Gathering Process
  22.       2.2.4.2 Breakdown of Primary Respondents
  23.     2.2.5 Forecasting Model
  24.     2.2.6 Market Size Estimation
  25.       2.2.6.1 Bottom-Up Approach
  26.       2.2.6.2 Top-Down Approach
  27.     2.2.7 Data Triangulation
  28.     2.2.8 Validation
  29. 3 SECTION III: QUALITATIVE ANALYSIS
  30.   3.1 MARKET DYNAMICS
  31.     3.1.1 Overview
  32.     3.1.2 Drivers
  33.     3.1.3 Restraints
  34.     3.1.4 Opportunities
  35.   3.2 MARKET FACTOR ANALYSIS
  36.     3.2.1 Value chain Analysis
  37.     3.2.2 Porter's Five Forces Analysis
  38.       3.2.2.1 Bargaining Power of Suppliers
  39.       3.2.2.2 Bargaining Power of Buyers
  40.       3.2.2.3 Threat of New Entrants
  41.       3.2.2.4 Threat of Substitutes
  42.       3.2.2.5 Intensity of Rivalry
  43.     3.2.3 COVID-19 Impact Analysis
  44.       3.2.3.1 Market Impact Analysis
  45.       3.2.3.2 Regional Impact
  46.       3.2.3.3 Opportunity and Threat Analysis
  47. 4 SECTION IV: QUANTITATIVE ANALYSIS
  48.   4.1 Food, Beverages & Nutrition, BY Type (USD Million)
  49.     4.1.1 Cloudy
  50.     4.1.2 Clear
  51.   4.2 Food, Beverages & Nutrition, BY Category (USD Million)
  52.     4.2.1 Flavored
  53.     4.2.2 Plain
  54.   4.3 Food, Beverages & Nutrition, BY Packaging (USD Million)
  55.     4.3.1 Bottles
  56.     4.3.2 Pouches
  57.     4.3.3 Cans
  58.     4.3.4 Others
  59.   4.4 Food, Beverages & Nutrition, BY Distribution Channel (USD Million)
  60.     4.4.1 Store-based
  61.     4.4.2 Non-store-based
  62. 5 SECTION V: COMPETITIVE ANALYSIS
  63.   5.1 Competitive Landscape
  64.     5.1.1 Overview
  65.     5.1.2 Competitive Analysis
  66.     5.1.3 Market share Analysis
  67.     5.1.4 Major Growth Strategy in the Food, Beverages & Nutrition
  68.     5.1.5 Competitive Benchmarking
  69.     5.1.6 Leading Players in Terms of Number of Developments in the Food, Beverages & Nutrition
  70.     5.1.7 Key developments and growth strategies
  71.       5.1.7.1 New Product Launch/Service Deployment
  72.       5.1.7.2 Merger & Acquisitions
  73.       5.1.7.3 Joint Ventures
  74.     5.1.8 Major Players Financial Matrix
  75.       5.1.8.1 Sales and Operating Income
  76.       5.1.8.2 Major Players R&D Expenditure. 2023
  77.   5.2 Company Profiles
  78.     5.2.1 Coca-Cola (US)
  79.       5.2.1.1 Financial Overview
  80.       5.2.1.2 Products Offered
  81.       5.2.1.3 Key Developments
  82.       5.2.1.4 SWOT Analysis
  83.       5.2.1.5 Key Strategies
  84.     5.2.2 PepsiCo (US)
  85.       5.2.2.1 Financial Overview
  86.       5.2.2.2 Products Offered
  87.       5.2.2.3 Key Developments
  88.       5.2.2.4 SWOT Analysis
  89.       5.2.2.5 Key Strategies
  90.     5.2.3 Nestle (CH)
  91.       5.2.3.1 Financial Overview
  92.       5.2.3.2 Products Offered
  93.       5.2.3.3 Key Developments
  94.       5.2.3.4 SWOT Analysis
  95.       5.2.3.5 Key Strategies
  96.     5.2.4 Dr Pepper Snapple Group (US)
  97.       5.2.4.1 Financial Overview
  98.       5.2.4.2 Products Offered
  99.       5.2.4.3 Key Developments
  100.       5.2.4.4 SWOT Analysis
  101.       5.2.4.5 Key Strategies
  102.     5.2.5 Monster Beverage Corporation (US)
  103.       5.2.5.1 Financial Overview
  104.       5.2.5.2 Products Offered
  105.       5.2.5.3 Key Developments
  106.       5.2.5.4 SWOT Analysis
  107.       5.2.5.5 Key Strategies
  108.     5.2.6 Simply Beverages (US)
  109.       5.2.6.1 Financial Overview
  110.       5.2.6.2 Products Offered
  111.       5.2.6.3 Key Developments
  112.       5.2.6.4 SWOT Analysis
  113.       5.2.6.5 Key Strategies
  114.     5.2.7 Honest Tea (US)
  115.       5.2.7.1 Financial Overview
  116.       5.2.7.2 Products Offered
  117.       5.2.7.3 Key Developments
  118.       5.2.7.4 SWOT Analysis
  119.       5.2.7.5 Key Strategies
  120.     5.2.8 Tropicana Products (US)
  121.       5.2.8.1 Financial Overview
  122.       5.2.8.2 Products Offered
  123.       5.2.8.3 Key Developments
  124.       5.2.8.4 SWOT Analysis
  125.       5.2.8.5 Key Strategies
  126.   5.3 Appendix
  127.     5.3.1 References
  128.     5.3.2 Related Reports
  129. 6 LIST OF FIGURES
  130.   6.1 MARKET SYNOPSIS
  131.   6.2 US MARKET ANALYSIS BY TYPE
  132.   6.3 US MARKET ANALYSIS BY CATEGORY
  133.   6.4 US MARKET ANALYSIS BY PACKAGING
  134.   6.5 US MARKET ANALYSIS BY DISTRIBUTION CHANNEL
  135.   6.6 KEY BUYING CRITERIA OF FOOD, BEVERAGES & NUTRITION
  136.   6.7 RESEARCH PROCESS OF MRFR
  137.   6.8 DRO ANALYSIS OF FOOD, BEVERAGES & NUTRITION
  138.   6.9 DRIVERS IMPACT ANALYSIS: FOOD, BEVERAGES & NUTRITION
  139.   6.10 RESTRAINTS IMPACT ANALYSIS: FOOD, BEVERAGES & NUTRITION
  140.   6.11 SUPPLY / VALUE CHAIN: FOOD, BEVERAGES & NUTRITION
  141.   6.12 FOOD, BEVERAGES & NUTRITION, BY TYPE, 2024 (% SHARE)
  142.   6.13 FOOD, BEVERAGES & NUTRITION, BY TYPE, 2024 TO 2035 (USD Million)
  143.   6.14 FOOD, BEVERAGES & NUTRITION, BY CATEGORY, 2024 (% SHARE)
  144.   6.15 FOOD, BEVERAGES & NUTRITION, BY CATEGORY, 2024 TO 2035 (USD Million)
  145.   6.16 FOOD, BEVERAGES & NUTRITION, BY PACKAGING, 2024 (% SHARE)
  146.   6.17 FOOD, BEVERAGES & NUTRITION, BY PACKAGING, 2024 TO 2035 (USD Million)
  147.   6.18 FOOD, BEVERAGES & NUTRITION, BY DISTRIBUTION CHANNEL, 2024 (% SHARE)
  148.   6.19 FOOD, BEVERAGES & NUTRITION, BY DISTRIBUTION CHANNEL, 2024 TO 2035 (USD Million)
  149.   6.20 BENCHMARKING OF MAJOR COMPETITORS
  150. 7 LIST OF TABLES
  151.   7.1 LIST OF ASSUMPTIONS
  152.     7.1.1
  153.   7.2 US MARKET SIZE ESTIMATES; FORECAST
  154.     7.2.1 BY TYPE, 2025-2035 (USD Million)
  155.     7.2.2 BY CATEGORY, 2025-2035 (USD Million)
  156.     7.2.3 BY PACKAGING, 2025-2035 (USD Million)
  157.     7.2.4 BY DISTRIBUTION CHANNEL, 2025-2035 (USD Million)
  158.   7.3 PRODUCT LAUNCH/PRODUCT DEVELOPMENT/APPROVAL
  159.     7.3.1
  160.   7.4 ACQUISITION/PARTNERSHIP
  161.     7.4.1

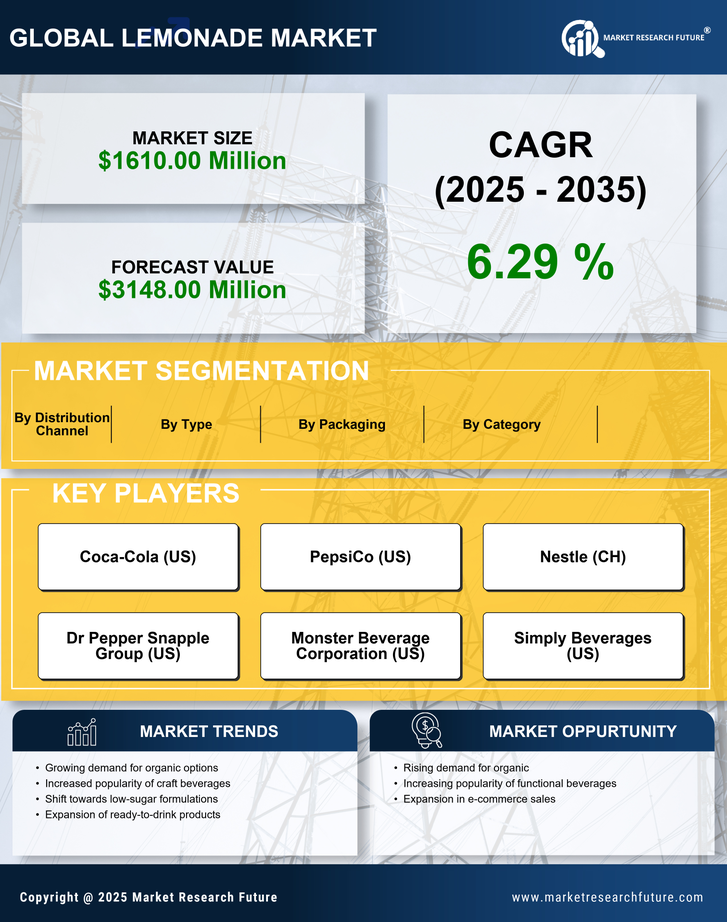
US Food, Beverages & Nutrition Market Segmentation

Food, Beverages & Nutrition By Type (USD Million, 2025-2035)

  • Cloudy
  • Clear

Food, Beverages & Nutrition By Category (USD Million, 2025-2035)

  • Flavored
  • Plain

Food, Beverages & Nutrition By Packaging (USD Million, 2025-2035)

  • Bottles
  • Pouches
  • Cans
  • Others

Food, Beverages & Nutrition By Distribution Channel (USD Million, 2025-2035)

  • Store-based
  • Non-store-based

Compare Licence

×
Features License Type
Single User Multiuser License Enterprise User
Price $4,950 $5,950 $7,250
Maximum User Access Limit 1 User Upto 10 Users Unrestricted Access Throughout the Organization
Free Customization
Direct Access to Analyst
Deliverable Format
Platform Access
Discount on Next Purchase 10% 15% 15%
Printable Versions