US Intelligent Virtual Assistant Market

ID: MRFR/SEM/12602-HCR
200 Pages
Nirmit Biswas
Last Updated: April 24, 2026
US Intelligent Virtual Assistant Market Size, Share and Research Report By Technology (Speech Recognition, Text-to-Speech, Voice Recognition), By Service (Customer Service, Marketing Assistance) and By End-Use Industry (BFSI, Automotive, IT & Telecom, Retail, Healthcare, Education) - Industry Forecast Till 2035
Download PDF ×

We do not share your information with anyone. However, we may send you emails based on your report interest from time to time. You may contact us at any time to opt-out.

US Intelligent Virtual Assistant Market

Market Size

Forecast Period2025 - 2035
CAGR (2025 - 2035)26.02%
2024 Market Size$ 1,834 Million
2025 Market Size$ 2,311.21 Million
2035 Market Size$ 23,340 Million

Key Players

Amazon
Google
Apple
Microsoft
IBM
Samsung
Opportunities
  • Integration with IoT Devices
  • Rising Demand for Automation
  • Increased Focus on Customer Experience
  1. 1 SECTION I: EXECUTIVE SUMMARY AND KEY HIGHLIGHTS
    1. 1.1 EXECUTIVE SUMMARY
      1. 1.1.1 Market Overview
      2. 1.1.2 Key Findings
      3. 1.1.3 Market Segmentation
      4. 1.1.4 Competitive Landscape
      5. 1.1.5 Challenges and Opportunities
      6. 1.1.6 Future Outlook
  2. 2 SECTION II: SCOPING, METHODOLOGY AND MARKET STRUCTURE
    1. 2.1 MARKET INTRODUCTION
      1. 2.1.1 Definition
      2. 2.1.2 Scope of the study
        1. 2.1.2.1 Research Objective
        2. 2.1.2.2 Assumption
        3. 2.1.2.3 Limitations
    2. 2.2 RESEARCH METHODOLOGY
      1. 2.2.1 Overview
      2. 2.2.2 Data Mining
      3. 2.2.3 Secondary Research
      4. 2.2.4 Primary Research
        1. 2.2.4.1 Primary Interviews and Information Gathering Process
        2. 2.2.4.2 Breakdown of Primary Respondents
      5. 2.2.5 Forecasting Model
      6. 2.2.6 Market Size Estimation
        1. 2.2.6.1 Bottom-Up Approach
        2. 2.2.6.2 Top-Down Approach
      7. 2.2.7 Data Triangulation
      8. 2.2.8 Validation
  3. 3 SECTION III: QUALITATIVE ANALYSIS
    1. 3.1 MARKET DYNAMICS
      1. 3.1.1 Overview
      2. 3.1.2 Drivers
      3. 3.1.3 Restraints
      4. 3.1.4 Opportunities
    2. 3.2 MARKET FACTOR ANALYSIS
      1. 3.2.1 Value chain Analysis
      2. 3.2.2 Porter's Five Forces Analysis
        1. 3.2.2.1 Bargaining Power of Suppliers
        2. 3.2.2.2 Bargaining Power of Buyers
        3. 3.2.2.3 Threat of New Entrants
        4. 3.2.2.4 Threat of Substitutes
        5. 3.2.2.5 Intensity of Rivalry
      3. 3.2.3 COVID-19 Impact Analysis
        1. 3.2.3.1 Market Impact Analysis
        2. 3.2.3.2 Regional Impact
        3. 3.2.3.3 Opportunity and Threat Analysis
  4. 4 SECTION IV: QUANTITATIVE ANALYSIS
    1. 4.1 Semiconductor & Electronics, BY Application (USD Million)
      1. 4.1.1 Customer Support
      2. 4.1.2 Personal Assistance
      3. 4.1.3 Sales and Marketing
      4. 4.1.4 Healthcare
    2. 4.2 Semiconductor & Electronics, BY Deployment Type (USD Million)
      1. 4.2.1 Cloud-based
      2. 4.2.2 On-premises
      3. 4.2.3 Hybrid
    3. 4.3 Semiconductor & Electronics, BY Technology (USD Million)
      1. 4.3.1 Natural Language Processing
      2. 4.3.2 Machine Learning
      3. 4.3.3 Speech Recognition
    4. 4.4 Semiconductor & Electronics, BY End Use (USD Million)
      1. 4.4.1 BFSI
      2. 4.4.2 Retail
      3. 4.4.3 Healthcare
      4. 4.4.4 Telecommunications
    5. 4.5 Semiconductor & Electronics, BY User Type (USD Million)
      1. 4.5.1 Small and Medium Enterprises
      2. 4.5.2 Large Enterprises
  5. 5 SECTION V: COMPETITIVE ANALYSIS
    1. 5.1 Competitive Landscape
      1. 5.1.1 Overview
      2. 5.1.2 Competitive Analysis
      3. 5.1.3 Market share Analysis
      4. 5.1.4 Major Growth Strategy in the Semiconductor & Electronics
      5. 5.1.5 Competitive Benchmarking
      6. 5.1.6 Leading Players in Terms of Number of Developments in the Semiconductor & Electronics
      7. 5.1.7 Key developments and growth strategies
        1. 5.1.7.1 New Product Launch/Service Deployment
        2. 5.1.7.2 Merger & Acquisitions
        3. 5.1.7.3 Joint Ventures
      8. 5.1.8 Major Players Financial Matrix
        1. 5.1.8.1 Sales and Operating Income
        2. 5.1.8.2 Major Players R&D Expenditure. 2023
    2. 5.2 Company Profiles
      1. 5.2.1 Amazon (US)
        1. 5.2.1.1 Financial Overview
        2. 5.2.1.2 Products Offered
        3. 5.2.1.3 Key Developments
        4. 5.2.1.4 SWOT Analysis
        5. 5.2.1.5 Key Strategies
      2. 5.2.2 Google (US)
        1. 5.2.2.1 Financial Overview
        2. 5.2.2.2 Products Offered
        3. 5.2.2.3 Key Developments
        4. 5.2.2.4 SWOT Analysis
        5. 5.2.2.5 Key Strategies
      3. 5.2.3 Apple (US)
        1. 5.2.3.1 Financial Overview
        2. 5.2.3.2 Products Offered
        3. 5.2.3.3 Key Developments
        4. 5.2.3.4 SWOT Analysis
        5. 5.2.3.5 Key Strategies
      4. 5.2.4 Microsoft (US)
        1. 5.2.4.1 Financial Overview
        2. 5.2.4.2 Products Offered
        3. 5.2.4.3 Key Developments
        4. 5.2.4.4 SWOT Analysis
        5. 5.2.4.5 Key Strategies
      5. 5.2.5 IBM (US)
        1. 5.2.5.1 Financial Overview
        2. 5.2.5.2 Products Offered
        3. 5.2.5.3 Key Developments
        4. 5.2.5.4 SWOT Analysis
        5. 5.2.5.5 Key Strategies
      6. 5.2.6 Samsung (KR)
        1. 5.2.6.1 Financial Overview
        2. 5.2.6.2 Products Offered
        3. 5.2.6.3 Key Developments
        4. 5.2.6.4 SWOT Analysis
        5. 5.2.6.5 Key Strategies
      7. 5.2.7 Baidu (CN)
        1. 5.2.7.1 Financial Overview
        2. 5.2.7.2 Products Offered
        3. 5.2.7.3 Key Developments
        4. 5.2.7.4 SWOT Analysis
        5. 5.2.7.5 Key Strategies
      8. 5.2.8 Alibaba (CN)
        1. 5.2.8.1 Financial Overview
        2. 5.2.8.2 Products Offered
        3. 5.2.8.3 Key Developments
        4. 5.2.8.4 SWOT Analysis
        5. 5.2.8.5 Key Strategies
      9. 5.2.9 Nuance Communications (US)
        1. 5.2.9.1 Financial Overview
        2. 5.2.9.2 Products Offered
        3. 5.2.9.3 Key Developments
        4. 5.2.9.4 SWOT Analysis
        5. 5.2.9.5 Key Strategies
    3. 5.3 Appendix
      1. 5.3.1 References
      2. 5.3.2 Related Reports
  6. 6 LIST OF FIGURES
    1. 6.1 MARKET SYNOPSIS
    2. 6.2 US MARKET ANALYSIS BY APPLICATION
    3. 6.3 US MARKET ANALYSIS BY DEPLOYMENT TYPE
    4. 6.4 US MARKET ANALYSIS BY TECHNOLOGY
    5. 6.5 US MARKET ANALYSIS BY END USE
    6. 6.6 US MARKET ANALYSIS BY USER TYPE
    7. 6.7 KEY BUYING CRITERIA OF SEMICONDUCTOR & ELECTRONICS
    8. 6.8 RESEARCH PROCESS OF MRFR
    9. 6.9 DRO ANALYSIS OF SEMICONDUCTOR & ELECTRONICS
    10. 6.10 DRIVERS IMPACT ANALYSIS: SEMICONDUCTOR & ELECTRONICS
    11. 6.11 RESTRAINTS IMPACT ANALYSIS: SEMICONDUCTOR & ELECTRONICS
    12. 6.12 SUPPLY / VALUE CHAIN: SEMICONDUCTOR & ELECTRONICS
    13. 6.13 SEMICONDUCTOR & ELECTRONICS, BY APPLICATION, 2024 (% SHARE)
    14. 6.14 SEMICONDUCTOR & ELECTRONICS, BY APPLICATION, 2024 TO 2035 (USD Million)
    15. 6.15 SEMICONDUCTOR & ELECTRONICS, BY DEPLOYMENT TYPE, 2024 (% SHARE)
    16. 6.16 SEMICONDUCTOR & ELECTRONICS, BY DEPLOYMENT TYPE, 2024 TO 2035 (USD Million)
    17. 6.17 SEMICONDUCTOR & ELECTRONICS, BY TECHNOLOGY, 2024 (% SHARE)
    18. 6.18 SEMICONDUCTOR & ELECTRONICS, BY TECHNOLOGY, 2024 TO 2035 (USD Million)
    19. 6.19 SEMICONDUCTOR & ELECTRONICS, BY END USE, 2024 (% SHARE)
    20. 6.20 SEMICONDUCTOR & ELECTRONICS, BY END USE, 2024 TO 2035 (USD Million)
    21. 6.21 SEMICONDUCTOR & ELECTRONICS, BY USER TYPE, 2024 (% SHARE)
    22. 6.22 SEMICONDUCTOR & ELECTRONICS, BY USER TYPE, 2024 TO 2035 (USD Million)
    23. 6.23 BENCHMARKING OF MAJOR COMPETITORS
  7. 7 LIST OF TABLES
    1. 7.1 LIST OF ASSUMPTIONS
  8. 7.1.1
    1. 7.2 US MARKET SIZE ESTIMATES; FORECAST
      1. 7.2.1 BY APPLICATION, 2025-2035 (USD Million)
      2. 7.2.2 BY DEPLOYMENT TYPE, 2025-2035 (USD Million)
      3. 7.2.3 BY TECHNOLOGY, 2025-2035 (USD Million)
      4. 7.2.4 BY END USE, 2025-2035 (USD Million)
      5. 7.2.5 BY USER TYPE, 2025-2035 (USD Million)
    2. 7.3 PRODUCT LAUNCH/PRODUCT DEVELOPMENT/APPROVAL
  9. 7.3.1
    1. 7.4 ACQUISITION/PARTNERSHIP
  10. 7.4.1

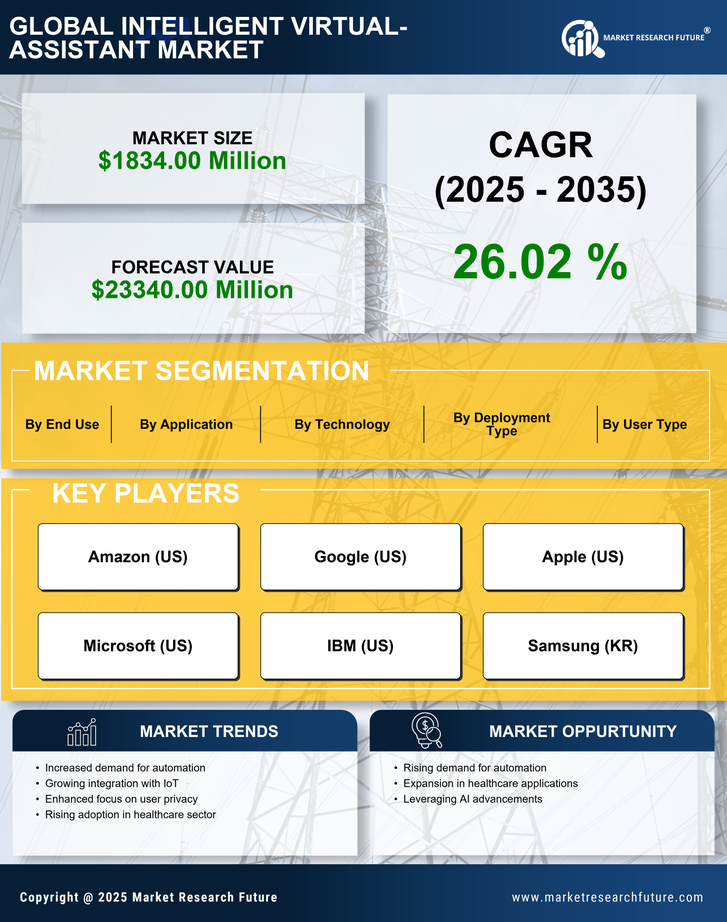
US US Intelligent Virtual Assistant Market Segmentation

US Intelligent Virtual Assistant Market By Application (USD Million, 2025-2035)

  • Customer Support
  • Personal Assistance
  • Sales and Marketing
  • Healthcare

US Intelligent Virtual Assistant Market By Deployment Type (USD Million, 2025-2035)

  • Cloud-based
  • On-premises
  • Hybrid

US Intelligent Virtual Assistant Market By Technology (USD Million, 2025-2035)

  • Natural Language Processing
  • Machine Learning
  • Speech Recognition

US Intelligent Virtual Assistant Market By End Use (USD Million, 2025-2035)

  • BFSI
  • Retail
  • Healthcare
  • Telecommunications

US Intelligent Virtual Assistant Market By User Type (USD Million, 2025-2035)

  • Small and Medium Enterprises
  • Large Enterprises