US Packaging & Transport Market Segmentation
Packaging & Transport By Application (USD Million, 2025-2035)
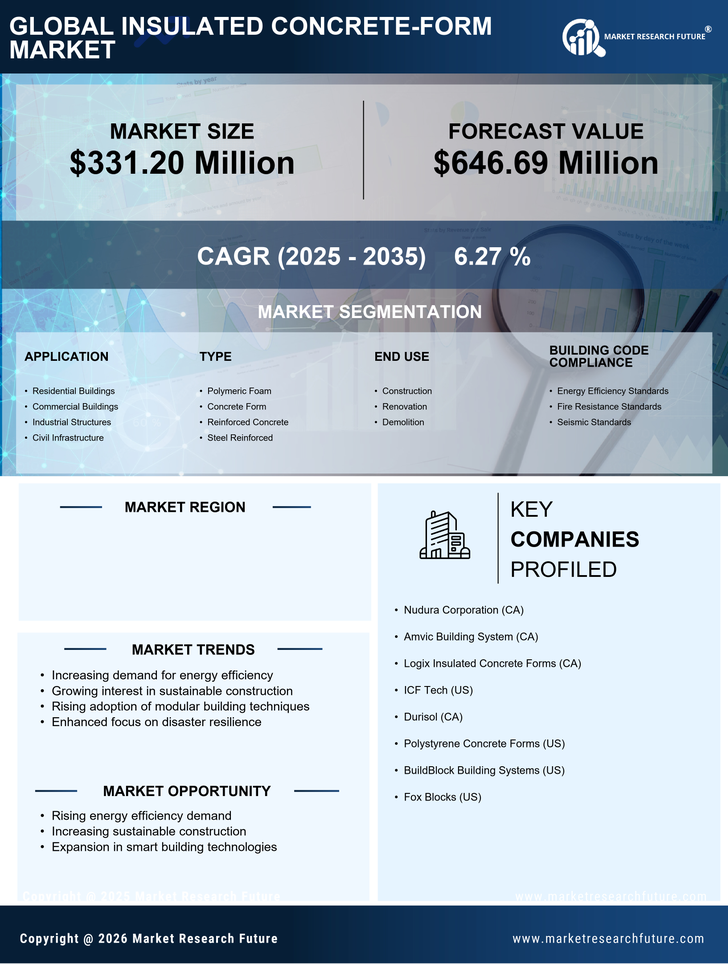
- Residential Buildings
- Commercial Buildings
- Industrial Structures
- Civil Infrastructure
Packaging & Transport By Type (USD Million, 2025-2035)
- Polymeric Foam
- Concrete Form
- Reinforced Concrete
- Steel Reinforced
Packaging & Transport By End Use (USD Million, 2025-2035)
- US Insulated Concrete Form Market
- Renovation
- Demolition
Packaging & Transport By Building Code Compliance (USD Million, 2025-2035)
- Energy Efficiency Standards
- Fire Resistance Standards
- Seismic Standards