Request Free Sample ×

Kindly complete the form below to receive a free sample of this Report

* Please use a valid business email

Leading companies partner with us for data-driven Insights

clients tt-cursor
Hero Background

US Home Decor Market

ID: MRFR/CG/19429-HCR
128 Pages
Garvit Vyas
Last Updated: April 06, 2026

US Home Decor Market Size, Share, Industry Trend & Analysis Research Report: By Product Type (Home Furniture, Home Textiles, Flooring, Wall Decor, Lighting, Others) andBy Distribution Channel (Home Décor Stores, Supermarkets and Hypermarkets, Online Store, Gift Shops, Others)- Forecast to 2035

Share:
Download PDF ×

We do not share your information with anyone. However, we may send you emails based on your report interest from time to time. You may contact us at any time to opt-out.

US Home Decor Market Infographic
Purchase Options
  1. 1 SECTION I: EXECUTIVE SUMMARY AND KEY HIGHLIGHTS
  2.   1.1 EXECUTIVE SUMMARY
  3.     1.1.1 Market Overview
  4.     1.1.2 Key Findings
  5.     1.1.3 Market Segmentation
  6.     1.1.4 Competitive Landscape
  7.     1.1.5 Challenges and Opportunities
  8.     1.1.6 Future Outlook
  9. 2 SECTION II: SCOPING, METHODOLOGY AND MARKET STRUCTURE
  10.   2.1 MARKET INTRODUCTION
  11.     2.1.1 Definition
  12.     2.1.2 Scope of the study
  13.       2.1.2.1 Research Objective
  14.       2.1.2.2 Assumption
  15.       2.1.2.3 Limitations
  16.   2.2 RESEARCH METHODOLOGY
  17.     2.2.1 Overview
  18.     2.2.2 Data Mining
  19.     2.2.3 Secondary Research
  20.     2.2.4 Primary Research
  21.       2.2.4.1 Primary Interviews and Information Gathering Process
  22.       2.2.4.2 Breakdown of Primary Respondents
  23.     2.2.5 Forecasting Model
  24.     2.2.6 Market Size Estimation
  25.       2.2.6.1 Bottom-Up Approach
  26.       2.2.6.2 Top-Down Approach
  27.     2.2.7 Data Triangulation
  28.     2.2.8 Validation
  29. 3 SECTION III: QUALITATIVE ANALYSIS
  30.   3.1 MARKET DYNAMICS
  31.     3.1.1 Overview
  32.     3.1.2 Drivers
  33.     3.1.3 Restraints
  34.     3.1.4 Opportunities
  35.   3.2 MARKET FACTOR ANALYSIS
  36.     3.2.1 Value chain Analysis
  37.     3.2.2 Porter's Five Forces Analysis
  38.       3.2.2.1 Bargaining Power of Suppliers
  39.       3.2.2.2 Bargaining Power of Buyers
  40.       3.2.2.3 Threat of New Entrants
  41.       3.2.2.4 Threat of Substitutes
  42.       3.2.2.5 Intensity of Rivalry
  43.     3.2.3 COVID-19 Impact Analysis
  44.       3.2.3.1 Market Impact Analysis
  45.       3.2.3.2 Regional Impact
  46.       3.2.3.3 Opportunity and Threat Analysis
  47. 4 SECTION IV: QUANTITATIVE ANALYSIS
  48.   4.1 Industrial Automation & Equipment, BY Type (USD Billion)
  49.     4.1.1 Furniture
  50.     4.1.2 Textiles
  51.     4.1.3 Wall Decor
  52.     4.1.4 Tableware
  53.     4.1.5 Lighting
  54.   4.2 Industrial Automation & Equipment, BY Material (USD Billion)
  55.     4.2.1 Wood
  56.     4.2.2 Metal
  57.     4.2.3 Glass
  58.     4.2.4 Plastic
  59.     4.2.5 Ceramic
  60.   4.3 Industrial Automation & Equipment, BY Style (USD Billion)
  61.     4.3.1 Modern
  62.     4.3.2 Traditional
  63.     4.3.3 Vintage
  64.     4.3.4 Industrial
  65.     4.3.5 Bohemian
  66.   4.4 Industrial Automation & Equipment, BY Distribution Channel (USD Billion)
  67.     4.4.1 Online Retail
  68.     4.4.2 Specialty Stores
  69.     4.4.3 Department Stores
  70.     4.4.4 Home Improvement Stores
  71. 5 SECTION V: COMPETITIVE ANALYSIS
  72.   5.1 Competitive Landscape
  73.     5.1.1 Overview
  74.     5.1.2 Competitive Analysis
  75.     5.1.3 Market share Analysis
  76.     5.1.4 Major Growth Strategy in the Industrial Automation & Equipment
  77.     5.1.5 Competitive Benchmarking
  78.     5.1.6 Leading Players in Terms of Number of Developments in the Industrial Automation & Equipment
  79.     5.1.7 Key developments and growth strategies
  80.       5.1.7.1 New Product Launch/Service Deployment
  81.       5.1.7.2 Merger & Acquisitions
  82.       5.1.7.3 Joint Ventures
  83.     5.1.8 Major Players Financial Matrix
  84.       5.1.8.1 Sales and Operating Income
  85.       5.1.8.2 Major Players R&D Expenditure. 2023
  86.   5.2 Company Profiles
  87.     5.2.1 IKEA (SE)
  88.       5.2.1.1 Financial Overview
  89.       5.2.1.2 Products Offered
  90.       5.2.1.3 Key Developments
  91.       5.2.1.4 SWOT Analysis
  92.       5.2.1.5 Key Strategies
  93.     5.2.2 Home Depot (US)
  94.       5.2.2.1 Financial Overview
  95.       5.2.2.2 Products Offered
  96.       5.2.2.3 Key Developments
  97.       5.2.2.4 SWOT Analysis
  98.       5.2.2.5 Key Strategies
  99.     5.2.3 Lowe's (US)
  100.       5.2.3.1 Financial Overview
  101.       5.2.3.2 Products Offered
  102.       5.2.3.3 Key Developments
  103.       5.2.3.4 SWOT Analysis
  104.       5.2.3.5 Key Strategies
  105.     5.2.4 Williams-Sonoma (US)
  106.       5.2.4.1 Financial Overview
  107.       5.2.4.2 Products Offered
  108.       5.2.4.3 Key Developments
  109.       5.2.4.4 SWOT Analysis
  110.       5.2.4.5 Key Strategies
  111.     5.2.5 Target (US)
  112.       5.2.5.1 Financial Overview
  113.       5.2.5.2 Products Offered
  114.       5.2.5.3 Key Developments
  115.       5.2.5.4 SWOT Analysis
  116.       5.2.5.5 Key Strategies
  117.     5.2.6 Bed Bath & Beyond (US)
  118.       5.2.6.1 Financial Overview
  119.       5.2.6.2 Products Offered
  120.       5.2.6.3 Key Developments
  121.       5.2.6.4 SWOT Analysis
  122.       5.2.6.5 Key Strategies
  123.     5.2.7 Wayfair (US)
  124.       5.2.7.1 Financial Overview
  125.       5.2.7.2 Products Offered
  126.       5.2.7.3 Key Developments
  127.       5.2.7.4 SWOT Analysis
  128.       5.2.7.5 Key Strategies
  129.     5.2.8 Ashley Furniture (US)
  130.       5.2.8.1 Financial Overview
  131.       5.2.8.2 Products Offered
  132.       5.2.8.3 Key Developments
  133.       5.2.8.4 SWOT Analysis
  134.       5.2.8.5 Key Strategies
  135.   5.3 Appendix
  136.     5.3.1 References
  137.     5.3.2 Related Reports
  138. 6 LIST OF FIGURES
  139.   6.1 MARKET SYNOPSIS
  140.   6.2 US MARKET ANALYSIS BY TYPE
  141.   6.3 US MARKET ANALYSIS BY MATERIAL
  142.   6.4 US MARKET ANALYSIS BY STYLE
  143.   6.5 US MARKET ANALYSIS BY DISTRIBUTION CHANNEL
  144.   6.6 KEY BUYING CRITERIA OF INDUSTRIAL AUTOMATION & EQUIPMENT
  145.   6.7 RESEARCH PROCESS OF MRFR
  146.   6.8 DRO ANALYSIS OF INDUSTRIAL AUTOMATION & EQUIPMENT
  147.   6.9 DRIVERS IMPACT ANALYSIS: INDUSTRIAL AUTOMATION & EQUIPMENT
  148.   6.10 RESTRAINTS IMPACT ANALYSIS: INDUSTRIAL AUTOMATION & EQUIPMENT
  149.   6.11 SUPPLY / VALUE CHAIN: INDUSTRIAL AUTOMATION & EQUIPMENT
  150.   6.12 INDUSTRIAL AUTOMATION & EQUIPMENT, BY TYPE, 2024 (% SHARE)
  151.   6.13 INDUSTRIAL AUTOMATION & EQUIPMENT, BY TYPE, 2024 TO 2035 (USD Billion)
  152.   6.14 INDUSTRIAL AUTOMATION & EQUIPMENT, BY MATERIAL, 2024 (% SHARE)
  153.   6.15 INDUSTRIAL AUTOMATION & EQUIPMENT, BY MATERIAL, 2024 TO 2035 (USD Billion)
  154.   6.16 INDUSTRIAL AUTOMATION & EQUIPMENT, BY STYLE, 2024 (% SHARE)
  155.   6.17 INDUSTRIAL AUTOMATION & EQUIPMENT, BY STYLE, 2024 TO 2035 (USD Billion)
  156.   6.18 INDUSTRIAL AUTOMATION & EQUIPMENT, BY DISTRIBUTION CHANNEL, 2024 (% SHARE)
  157.   6.19 INDUSTRIAL AUTOMATION & EQUIPMENT, BY DISTRIBUTION CHANNEL, 2024 TO 2035 (USD Billion)
  158.   6.20 BENCHMARKING OF MAJOR COMPETITORS
  159. 7 LIST OF TABLES
  160.   7.1 LIST OF ASSUMPTIONS
  161.     7.1.1
  162.   7.2 US MARKET SIZE ESTIMATES; FORECAST
  163.     7.2.1 BY TYPE, 2025-2035 (USD Billion)
  164.     7.2.2 BY MATERIAL, 2025-2035 (USD Billion)
  165.     7.2.3 BY STYLE, 2025-2035 (USD Billion)
  166.     7.2.4 BY DISTRIBUTION CHANNEL, 2025-2035 (USD Billion)
  167.   7.3 PRODUCT LAUNCH/PRODUCT DEVELOPMENT/APPROVAL
  168.     7.3.1
  169.   7.4 ACQUISITION/PARTNERSHIP
  170.     7.4.1

US Industrial Automation & Equipment Market Segmentation

Industrial Automation & Equipment By Type (USD Billion, 2025-2035)
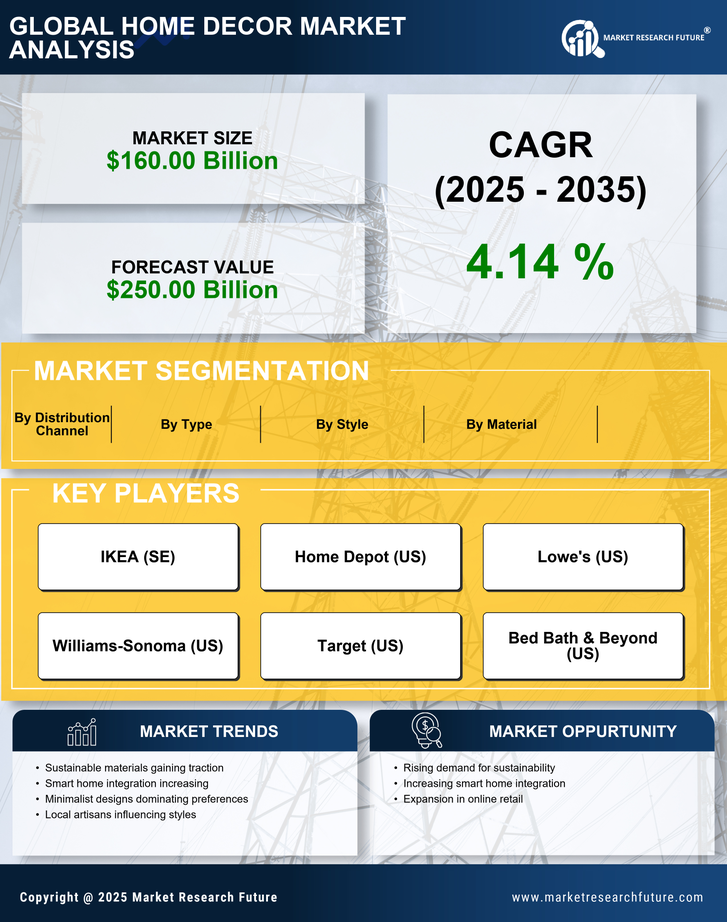
  • Furniture
  • Textiles
  • Wall Decor
  • Tableware
  • Lighting

Industrial Automation & Equipment By Material (USD Billion, 2025-2035)

  • Wood
  • Metal
  • Glass
  • Plastic
  • Ceramic

Industrial Automation & Equipment By Style (USD Billion, 2025-2035)

  • Modern
  • Traditional
  • Vintage
  • Industrial
  • Bohemian

Industrial Automation & Equipment By Distribution Channel (USD Billion, 2025-2035)

  • Online Retail
  • Specialty Stores
  • Department Stores
  • Home Improvement Stores

Compare Licence

×
Features License Type
Single User Multiuser License Enterprise User
Price $4,950 $5,950 $7,250
Maximum User Access Limit 1 User Upto 10 Users Unrestricted Access Throughout the Organization
Free Customization
Direct Access to Analyst
Deliverable Format
Platform Access
Discount on Next Purchase 10% 15% 15%
Printable Versions