US Chemicals and Materials Market Segmentation
Chemicals and Materials By Surgical Technique (USD Million, 2025-2035)
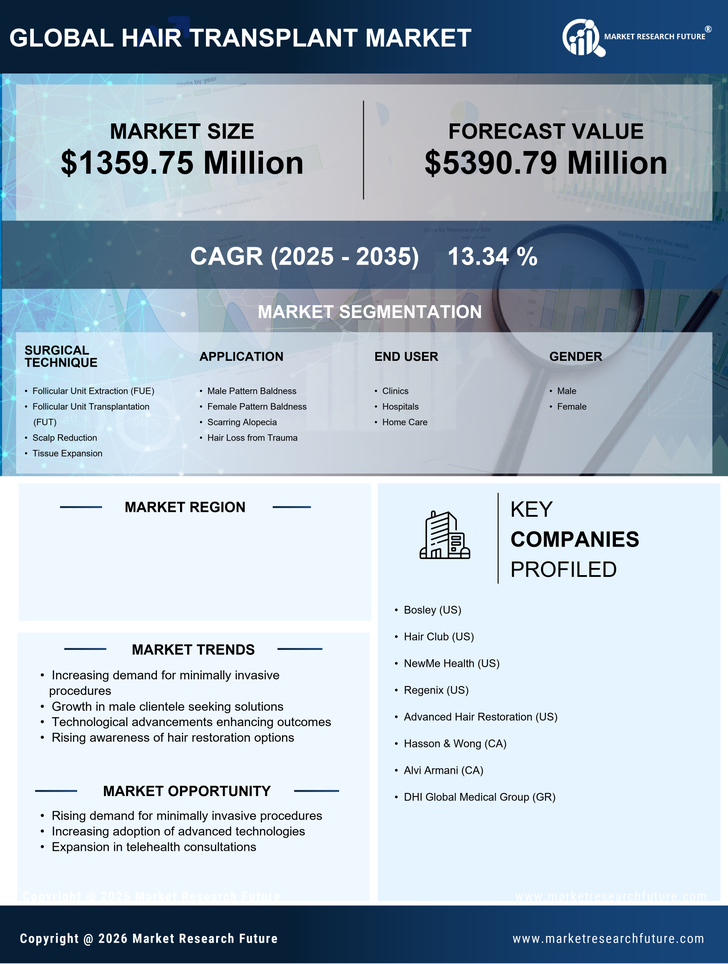
- Follicular Unit Extraction (FUE)
- Follicular Unit Transplantation (FUT)
- Scalp Reduction
- Tissue Expansion
Chemicals and Materials By Application (USD Million, 2025-2035)
- Male Pattern Baldness
- Female Pattern Baldness
- Scarring Alopecia
- Hair Loss from Trauma
Chemicals and Materials By End User (USD Million, 2025-2035)
- Clinics
- Hospitals
- Home Care
Chemicals and Materials By Gender (USD Million, 2025-2035)
- Male
- Female