US Chemicals and Materials Market Segmentation
Chemicals and Materials By Type (USD Million, 2025-2035)
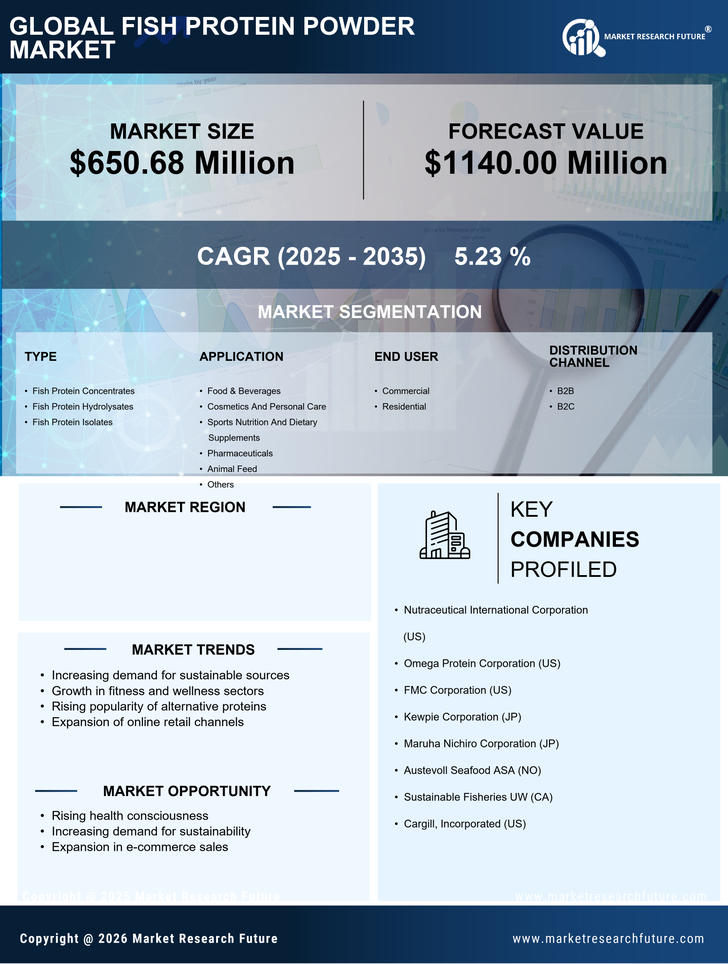
- Fish Protein Concentrates
- Fish Protein Hydrolysates
- Fish Protein Isolates
Chemicals and Materials By Application (USD Million, 2025-2035)
- Food & Beverages
- Cosmetics And Personal Care
- Sports Nutrition And Dietary Supplements
- Pharmaceuticals
- Animal Feed
- Others
Chemicals and Materials By End User (USD Million, 2025-2035)
- Commercial
- Residential
Chemicals and Materials By Distribution Channel (USD Million, 2025-2035)
- B2B
- B2C