Request Free Sample ×

Kindly complete the form below to receive a free sample of this Report

* Please use a valid business email

Leading companies partner with us for data-driven Insights

clients tt-cursor
Hero Background

US Fabry Disease Market

ID: MRFR/HC/16514-CR
100 Pages
Satyendra Maurya
Last Updated: January 29, 2026

US Fabry Disease Market Research Report: Size, Share, Trend Analysis By Types (Type 1, Type 2) By Diagnosis (Blood Test, Urine Test, Thyroid Test, Lung Function Test, Imaging, Hearing and Eye Examination, Others) By End Userss (Hospitals & Clinics, Diagnostic Centers, Research & Academic Institutes, Others) By Treatment (Enzyme Replacement Therapy, Gene Therapy, Pharmaceutical Treatments containing Agalsidase Alfa, Analgesics, Anticonvulsants, Nonsteroidal Anti-Inflammatory Drugs (NSAIDs), Others) - Growth Outlook & Industry Forecast 2025 To 2035

Share:
Download PDF ×

We do not share your information with anyone. However, we may send you emails based on your report interest from time to time. You may contact us at any time to opt-out.

US Fabry Disease Market Infographic
Purchase Options
  1. 1 SECTION I: EXECUTIVE SUMMARY AND KEY HIGHLIGHTS
  2.   1.1 EXECUTIVE SUMMARY
  3.     1.1.1 Market Overview
  4.     1.1.2 Key Findings
  5.     1.1.3 Market Segmentation
  6.     1.1.4 Competitive Landscape
  7.     1.1.5 Challenges and Opportunities
  8.     1.1.6 Future Outlook
  9. 2 SECTION II: SCOPING, METHODOLOGY AND MARKET STRUCTURE
  10.   2.1 MARKET INTRODUCTION
  11.     2.1.1 Definition
  12.     2.1.2 Scope of the study
  13.       2.1.2.1 Research Objective
  14.       2.1.2.2 Assumption
  15.       2.1.2.3 Limitations
  16.   2.2 RESEARCH METHODOLOGY
  17.     2.2.1 Overview
  18.     2.2.2 Data Mining
  19.     2.2.3 Secondary Research
  20.     2.2.4 Primary Research
  21.       2.2.4.1 Primary Interviews and Information Gathering Process
  22.       2.2.4.2 Breakdown of Primary Respondents
  23.     2.2.5 Forecasting Model
  24.     2.2.6 Market Size Estimation
  25.       2.2.6.1 Bottom-Up Approach
  26.       2.2.6.2 Top-Down Approach
  27.     2.2.7 Data Triangulation
  28.     2.2.8 Validation
  29. 3 SECTION III: QUALITATIVE ANALYSIS
  30.   3.1 MARKET DYNAMICS
  31.     3.1.1 Overview
  32.     3.1.2 Drivers
  33.     3.1.3 Restraints
  34.     3.1.4 Opportunities
  35.   3.2 MARKET FACTOR ANALYSIS
  36.     3.2.1 Value chain Analysis
  37.     3.2.2 Porter's Five Forces Analysis
  38.       3.2.2.1 Bargaining Power of Suppliers
  39.       3.2.2.2 Bargaining Power of Buyers
  40.       3.2.2.3 Threat of New Entrants
  41.       3.2.2.4 Threat of Substitutes
  42.       3.2.2.5 Intensity of Rivalry
  43.     3.2.3 COVID-19 Impact Analysis
  44.       3.2.3.1 Market Impact Analysis
  45.       3.2.3.2 Regional Impact
  46.       3.2.3.3 Opportunity and Threat Analysis
  47. 4 SECTION IV: QUANTITATIVE ANALYSIS
  48.   4.1 Construction, BY Type (USD Million)
  49.     4.1.1 Type 1
  50.     4.1.2 Type 2
  51.   4.2 Construction, BY Diagnosis (USD Million)
  52.     4.2.1 Blood Test
  53.     4.2.2 Urine Test
  54.     4.2.3 Thyroid Test
  55.     4.2.4 Lung Function Test
  56.     4.2.5 Imaging
  57.     4.2.6 Hearing and Eye Examination
  58.     4.2.7 Others
  59.   4.3 Construction, BY Treatment (USD Million)
  60.     4.3.1 Enzyme Replacement Therapy
  61.     4.3.2 Gene Therapy
  62.     4.3.3 Pharmaceutical Treatments containing Agalsidase Alfa
  63.     4.3.4 Analgesics
  64.     4.3.5 Anticonvulsants
  65.     4.3.6 Nonsteroidal Anti-Inflammatory Drugs (NSAIDs)
  66.     4.3.7 Others
  67.   4.4 Construction, BY End Users (USD Million)
  68.     4.4.1 Hospitals & Clinics
  69.     4.4.2 Diagnostic Centers
  70.     4.4.3 Research & Academic Institutes
  71.     4.4.4 Others
  72. 5 SECTION V: COMPETITIVE ANALYSIS
  73.   5.1 Competitive Landscape
  74.     5.1.1 Overview
  75.     5.1.2 Competitive Analysis
  76.     5.1.3 Market share Analysis
  77.     5.1.4 Major Growth Strategy in the Construction
  78.     5.1.5 Competitive Benchmarking
  79.     5.1.6 Leading Players in Terms of Number of Developments in the Construction
  80.     5.1.7 Key developments and growth strategies
  81.       5.1.7.1 New Product Launch/Service Deployment
  82.       5.1.7.2 Merger & Acquisitions
  83.       5.1.7.3 Joint Ventures
  84.     5.1.8 Major Players Financial Matrix
  85.       5.1.8.1 Sales and Operating Income
  86.       5.1.8.2 Major Players R&D Expenditure. 2023
  87.   5.2 Company Profiles
  88.     5.2.1 Sanofi (FR)
  89.       5.2.1.1 Financial Overview
  90.       5.2.1.2 Products Offered
  91.       5.2.1.3 Key Developments
  92.       5.2.1.4 SWOT Analysis
  93.       5.2.1.5 Key Strategies
  94.     5.2.2 Amicus Therapeutics (US)
  95.       5.2.2.1 Financial Overview
  96.       5.2.2.2 Products Offered
  97.       5.2.2.3 Key Developments
  98.       5.2.2.4 SWOT Analysis
  99.       5.2.2.5 Key Strategies
  100.     5.2.3 Takeda Pharmaceutical Company (JP)
  101.       5.2.3.1 Financial Overview
  102.       5.2.3.2 Products Offered
  103.       5.2.3.3 Key Developments
  104.       5.2.3.4 SWOT Analysis
  105.       5.2.3.5 Key Strategies
  106.     5.2.4 Genzyme (US)
  107.       5.2.4.1 Financial Overview
  108.       5.2.4.2 Products Offered
  109.       5.2.4.3 Key Developments
  110.       5.2.4.4 SWOT Analysis
  111.       5.2.4.5 Key Strategies
  112.     5.2.5 Pfizer (US)
  113.       5.2.5.1 Financial Overview
  114.       5.2.5.2 Products Offered
  115.       5.2.5.3 Key Developments
  116.       5.2.5.4 SWOT Analysis
  117.       5.2.5.5 Key Strategies
  118.     5.2.6 Sobi (SE)
  119.       5.2.6.1 Financial Overview
  120.       5.2.6.2 Products Offered
  121.       5.2.6.3 Key Developments
  122.       5.2.6.4 SWOT Analysis
  123.       5.2.6.5 Key Strategies
  124.     5.2.7 Bayer (DE)
  125.       5.2.7.1 Financial Overview
  126.       5.2.7.2 Products Offered
  127.       5.2.7.3 Key Developments
  128.       5.2.7.4 SWOT Analysis
  129.       5.2.7.5 Key Strategies
  130.     5.2.8 Janssen Pharmaceuticals (US)
  131.       5.2.8.1 Financial Overview
  132.       5.2.8.2 Products Offered
  133.       5.2.8.3 Key Developments
  134.       5.2.8.4 SWOT Analysis
  135.       5.2.8.5 Key Strategies
  136.   5.3 Appendix
  137.     5.3.1 References
  138.     5.3.2 Related Reports
  139. 6 LIST OF FIGURES
  140.   6.1 MARKET SYNOPSIS
  141.   6.2 US MARKET ANALYSIS BY TYPE
  142.   6.3 US MARKET ANALYSIS BY DIAGNOSIS
  143.   6.4 US MARKET ANALYSIS BY TREATMENT
  144.   6.5 US MARKET ANALYSIS BY END USERS
  145.   6.6 KEY BUYING CRITERIA OF CONSTRUCTION
  146.   6.7 RESEARCH PROCESS OF MRFR
  147.   6.8 DRO ANALYSIS OF CONSTRUCTION
  148.   6.9 DRIVERS IMPACT ANALYSIS: CONSTRUCTION
  149.   6.10 RESTRAINTS IMPACT ANALYSIS: CONSTRUCTION
  150.   6.11 SUPPLY / VALUE CHAIN: CONSTRUCTION
  151.   6.12 CONSTRUCTION, BY TYPE, 2024 (% SHARE)
  152.   6.13 CONSTRUCTION, BY TYPE, 2024 TO 2035 (USD Million)
  153.   6.14 CONSTRUCTION, BY DIAGNOSIS, 2024 (% SHARE)
  154.   6.15 CONSTRUCTION, BY DIAGNOSIS, 2024 TO 2035 (USD Million)
  155.   6.16 CONSTRUCTION, BY TREATMENT, 2024 (% SHARE)
  156.   6.17 CONSTRUCTION, BY TREATMENT, 2024 TO 2035 (USD Million)
  157.   6.18 CONSTRUCTION, BY END USERS, 2024 (% SHARE)
  158.   6.19 CONSTRUCTION, BY END USERS, 2024 TO 2035 (USD Million)
  159.   6.20 BENCHMARKING OF MAJOR COMPETITORS
  160. 7 LIST OF TABLES
  161.   7.1 LIST OF ASSUMPTIONS
  162.     7.1.1
  163.   7.2 US MARKET SIZE ESTIMATES; FORECAST
  164.     7.2.1 BY TYPE, 2025-2035 (USD Million)
  165.     7.2.2 BY DIAGNOSIS, 2025-2035 (USD Million)
  166.     7.2.3 BY TREATMENT, 2025-2035 (USD Million)
  167.     7.2.4 BY END USERS, 2025-2035 (USD Million)
  168.   7.3 PRODUCT LAUNCH/PRODUCT DEVELOPMENT/APPROVAL
  169.     7.3.1
  170.   7.4 ACQUISITION/PARTNERSHIP
  171.     7.4.1

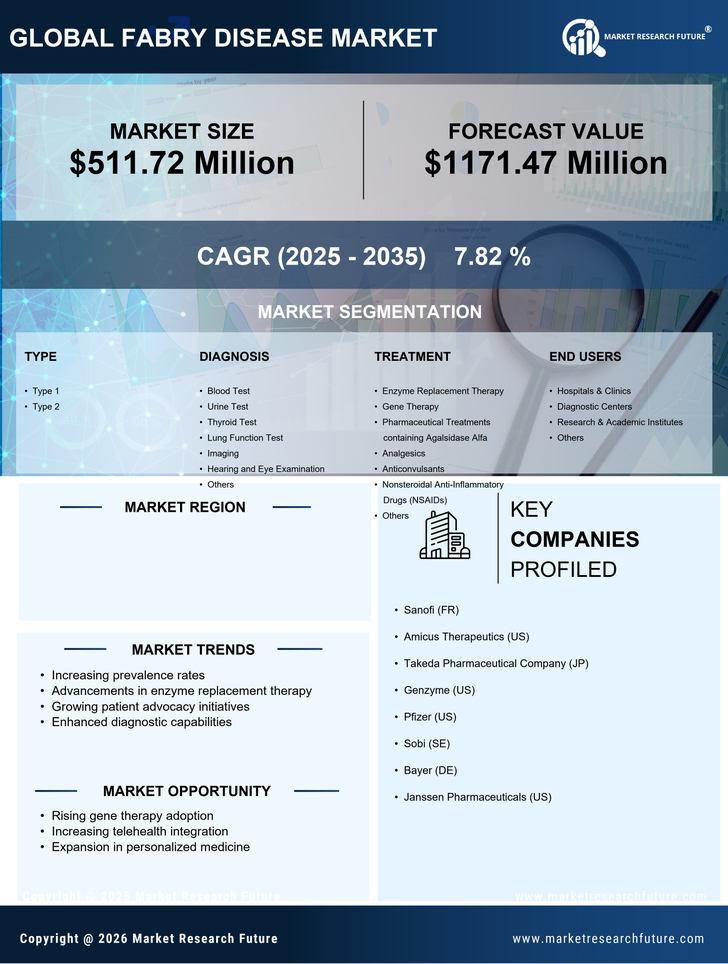
US Construction Market Segmentation

Construction By Type (USD Million, 2025-2035)

  • Type 1
  • Type 2

Construction By Diagnosis (USD Million, 2025-2035)

  • Blood Test
  • Urine Test
  • Thyroid Test
  • Lung Function Test
  • Imaging
  • Hearing and Eye Examination
  • Others

Construction By Treatment (USD Million, 2025-2035)

  • Enzyme Replacement Therapy
  • Gene Therapy
  • Pharmaceutical Treatments containing Agalsidase Alfa
  • Analgesics
  • Anticonvulsants
  • Nonsteroidal Anti-Inflammatory Drugs (NSAIDs)
  • Others

Construction By End Users (USD Million, 2025-2035)

  • Hospitals & Clinics
  • Diagnostic Centers
  • Research & Academic Institutes
  • Others

Compare Licence

×
Features License Type
Single User Multiuser License Enterprise User
Price $4,950 $5,950 $7,250
Maximum User Access Limit 1 User Upto 10 Users Unrestricted Access Throughout the Organization
Free Customization
Direct Access to Analyst
Deliverable Format
Platform Access
Discount on Next Purchase 10% 15% 15%
Printable Versions