US Doxorubicin Market

ID: MRFR/MED/17461-HCR
100 Pages
Rahul Gotadki
Last Updated: April 06, 2026
US Doxorubicin Market Research Report: Size, Share, Trend Analysis By Applications (Breast Cancer, Lung Cancer, Leukemia, Ovarian Cancer), By Formulation (Injection, Lyophilized Powder, Tablet), By Distribution Channel (Hospital Pharmacy, Retail Pharmacy, Online Pharmacy) and By End Use (Hospitals, Cancer Research Institutes, Homecare) - Growth Outlook & Industry Forecast 2025 To 2035
Download PDF ×

We do not share your information with anyone. However, we may send you emails based on your report interest from time to time. You may contact us at any time to opt-out.

US Doxorubicin Market

Market Size

Forecast Period2025 - 2035
CAGR (2025 - 2035)4.81%
2024 Market Size$ 504.03 Million
2025 Market Size$ 528.27 Million
2035 Market Size$ 845.06 Million

Key Players

Teva Pharmaceutical Industries Ltd
Sandoz International GmbH
Mylan N.V.
Bristol-Myers Squibb Company
Eisai Co.
Ltd.
Opportunities
  • Growing Focus on Personalized Medicine
  • Increasing Demand for Cancer Treatments
  • Expansion of Oncology Research and Clinical Trials
  1. 1 SECTION I: EXECUTIVE SUMMARY AND KEY HIGHLIGHTS
    1. 1.1 EXECUTIVE SUMMARY
      1. 1.1.1 Market Overview
      2. 1.1.2 Key Findings
      3. 1.1.3 Market Segmentation
      4. 1.1.4 Competitive Landscape
      5. 1.1.5 Challenges and Opportunities
      6. 1.1.6 Future Outlook
  2. 2 SECTION II: SCOPING, METHODOLOGY AND MARKET STRUCTURE
    1. 2.1 MARKET INTRODUCTION
      1. 2.1.1 Definition
      2. 2.1.2 Scope of the study
        1. 2.1.2.1 Research Objective
        2. 2.1.2.2 Assumption
        3. 2.1.2.3 Limitations
    2. 2.2 RESEARCH METHODOLOGY
      1. 2.2.1 Overview
      2. 2.2.2 Data Mining
      3. 2.2.3 Secondary Research
      4. 2.2.4 Primary Research
        1. 2.2.4.1 Primary Interviews and Information Gathering Process
        2. 2.2.4.2 Breakdown of Primary Respondents
      5. 2.2.5 Forecasting Model
      6. 2.2.6 Market Size Estimation
        1. 2.2.6.1 Bottom-Up Approach
        2. 2.2.6.2 Top-Down Approach
      7. 2.2.7 Data Triangulation
      8. 2.2.8 Validation
  3. 3 SECTION III: QUALITATIVE ANALYSIS
    1. 3.1 MARKET DYNAMICS
      1. 3.1.1 Overview
      2. 3.1.2 Drivers
      3. 3.1.3 Restraints
      4. 3.1.4 Opportunities
    2. 3.2 MARKET FACTOR ANALYSIS
      1. 3.2.1 Value chain Analysis
      2. 3.2.2 Porter's Five Forces Analysis
        1. 3.2.2.1 Bargaining Power of Suppliers
        2. 3.2.2.2 Bargaining Power of Buyers
        3. 3.2.2.3 Threat of New Entrants
        4. 3.2.2.4 Threat of Substitutes
        5. 3.2.2.5 Intensity of Rivalry
      3. 3.2.3 COVID-19 Impact Analysis
        1. 3.2.3.1 Market Impact Analysis
        2. 3.2.3.2 Regional Impact
        3. 3.2.3.3 Opportunity and Threat Analysis
  4. 4 SECTION IV: QUANTITATIVE ANALYSIS
    1. 4.1 Healthcare, BY Application (USD Million)
      1. 4.1.1 Breast Cancer
      2. 4.1.2 Lung Cancer
      3. 4.1.3 Leukemia
      4. 4.1.4 Ovarian Cancer
    2. 4.2 Healthcare, BY Formulation (USD Million)
      1. 4.2.1 Injection
      2. 4.2.2 Lyophilized Powder
      3. 4.2.3 Tablet
    3. 4.3 Healthcare, BY Distribution Channel (USD Million)
      1. 4.3.1 Hospital Pharmacy
      2. 4.3.2 Retail Pharmacy
      3. 4.3.3 Online Pharmacy
    4. 4.4 Healthcare, BY End-Use (USD Million)
      1. 4.4.1 Hospitals
      2. 4.4.2 Cancer Research Institutes
      3. 4.4.3 Homecare
  5. 5 SECTION V: COMPETITIVE ANALYSIS
    1. 5.1 Competitive Landscape
      1. 5.1.1 Overview
      2. 5.1.2 Competitive Analysis
      3. 5.1.3 Market share Analysis
      4. 5.1.4 Major Growth Strategy in the Healthcare
      5. 5.1.5 Competitive Benchmarking
      6. 5.1.6 Leading Players in Terms of Number of Developments in the Healthcare
      7. 5.1.7 Key developments and growth strategies
        1. 5.1.7.1 New Product Launch/Service Deployment
        2. 5.1.7.2 Merger & Acquisitions
        3. 5.1.7.3 Joint Ventures
      8. 5.1.8 Major Players Financial Matrix
        1. 5.1.8.1 Sales and Operating Income
        2. 5.1.8.2 Major Players R&D Expenditure. 2023
    2. 5.2 Company Profiles
      1. 5.2.1 Teva Pharmaceutical Industries Ltd (IL)
        1. 5.2.1.1 Financial Overview
        2. 5.2.1.2 Products Offered
        3. 5.2.1.3 Key Developments
        4. 5.2.1.4 SWOT Analysis
        5. 5.2.1.5 Key Strategies
      2. 5.2.2 Sandoz International GmbH (AT)
        1. 5.2.2.1 Financial Overview
        2. 5.2.2.2 Products Offered
        3. 5.2.2.3 Key Developments
        4. 5.2.2.4 SWOT Analysis
        5. 5.2.2.5 Key Strategies
      3. 5.2.3 Mylan N.V. (NL)
        1. 5.2.3.1 Financial Overview
        2. 5.2.3.2 Products Offered
        3. 5.2.3.3 Key Developments
        4. 5.2.3.4 SWOT Analysis
        5. 5.2.3.5 Key Strategies
      4. 5.2.4 Bristol-Myers Squibb Company (US)
        1. 5.2.4.1 Financial Overview
        2. 5.2.4.2 Products Offered
        3. 5.2.4.3 Key Developments
        4. 5.2.4.4 SWOT Analysis
        5. 5.2.4.5 Key Strategies
      5. 5.2.5 Eisai Co., Ltd. (JP)
        1. 5.2.5.1 Financial Overview
        2. 5.2.5.2 Products Offered
        3. 5.2.5.3 Key Developments
        4. 5.2.5.4 SWOT Analysis
        5. 5.2.5.5 Key Strategies
      6. 5.2.6 Pfizer Inc. (US)
        1. 5.2.6.1 Financial Overview
        2. 5.2.6.2 Products Offered
        3. 5.2.6.3 Key Developments
        4. 5.2.6.4 SWOT Analysis
        5. 5.2.6.5 Key Strategies
      7. 5.2.7 Novartis AG (CH)
        1. 5.2.7.1 Financial Overview
        2. 5.2.7.2 Products Offered
        3. 5.2.7.3 Key Developments
        4. 5.2.7.4 SWOT Analysis
        5. 5.2.7.5 Key Strategies
      8. 5.2.8 Hikma Pharmaceuticals PLC (GB)
        1. 5.2.8.1 Financial Overview
        2. 5.2.8.2 Products Offered
        3. 5.2.8.3 Key Developments
        4. 5.2.8.4 SWOT Analysis
        5. 5.2.8.5 Key Strategies
    3. 5.3 Appendix
      1. 5.3.1 References
      2. 5.3.2 Related Reports
  6. 6 LIST OF FIGURES
    1. 6.1 MARKET SYNOPSIS
    2. 6.2 US MARKET ANALYSIS BY APPLICATION
    3. 6.3 US MARKET ANALYSIS BY FORMULATION
    4. 6.4 US MARKET ANALYSIS BY DISTRIBUTION CHANNEL
    5. 6.5 US MARKET ANALYSIS BY END-USE
    6. 6.6 KEY BUYING CRITERIA OF HEALTHCARE
    7. 6.7 RESEARCH PROCESS OF MRFR
    8. 6.8 DRO ANALYSIS OF HEALTHCARE
    9. 6.9 DRIVERS IMPACT ANALYSIS: HEALTHCARE
    10. 6.10 RESTRAINTS IMPACT ANALYSIS: HEALTHCARE
    11. 6.11 SUPPLY / VALUE CHAIN: HEALTHCARE
    12. 6.12 HEALTHCARE, BY APPLICATION, 2024 (% SHARE)
    13. 6.13 HEALTHCARE, BY APPLICATION, 2024 TO 2035 (USD Million)
    14. 6.14 HEALTHCARE, BY FORMULATION, 2024 (% SHARE)
    15. 6.15 HEALTHCARE, BY FORMULATION, 2024 TO 2035 (USD Million)
    16. 6.16 HEALTHCARE, BY DISTRIBUTION CHANNEL, 2024 (% SHARE)
    17. 6.17 HEALTHCARE, BY DISTRIBUTION CHANNEL, 2024 TO 2035 (USD Million)
    18. 6.18 HEALTHCARE, BY END-USE, 2024 (% SHARE)
    19. 6.19 HEALTHCARE, BY END-USE, 2024 TO 2035 (USD Million)
    20. 6.20 BENCHMARKING OF MAJOR COMPETITORS
  7. 7 LIST OF TABLES
    1. 7.1 LIST OF ASSUMPTIONS
  8. 7.1.1
    1. 7.2 US MARKET SIZE ESTIMATES; FORECAST
      1. 7.2.1 BY APPLICATION, 2025-2035 (USD Million)
      2. 7.2.2 BY FORMULATION, 2025-2035 (USD Million)
      3. 7.2.3 BY DISTRIBUTION CHANNEL, 2025-2035 (USD Million)
      4. 7.2.4 BY END-USE, 2025-2035 (USD Million)
    2. 7.3 PRODUCT LAUNCH/PRODUCT DEVELOPMENT/APPROVAL
  9. 7.3.1
    1. 7.4 ACQUISITION/PARTNERSHIP
  10. 7.4.1

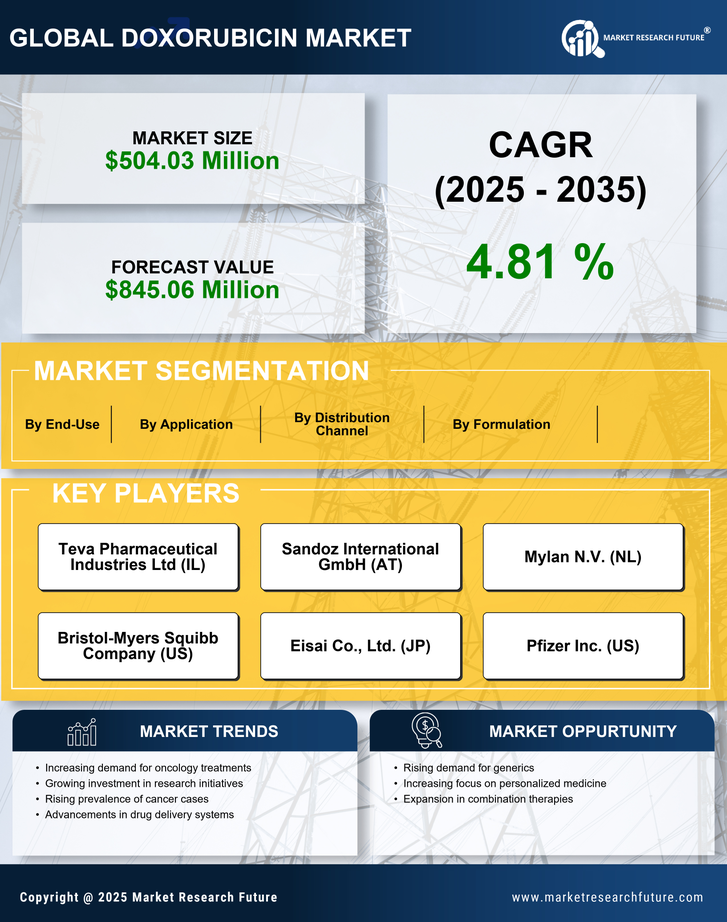
US Doxorubicin Market Segmentation

US Doxorubicin Market By Application (USD Million, 2025-2035)

  • Breast Cancer
  • Lung Cancer
  • Leukemia
  • Ovarian Cancer

US Doxorubicin Market By Formulation (USD Million, 2025-2035)

  • Injection
  • Lyophilized Powder
  • Tablet

US Doxorubicin Market By Distribution Channel (USD Million, 2025-2035)

  • Hospital Pharmacy
  • Retail Pharmacy
  • Online Pharmacy

US Doxorubicin Market By End-Use (USD Million, 2025-2035)

  • Hospitals
  • Cancer Research Institutes
  • Homecare