US Industrial Automation & Equipment Market Segmentation
Industrial Automation & Equipment By Application (USD Million, 2025-2035)
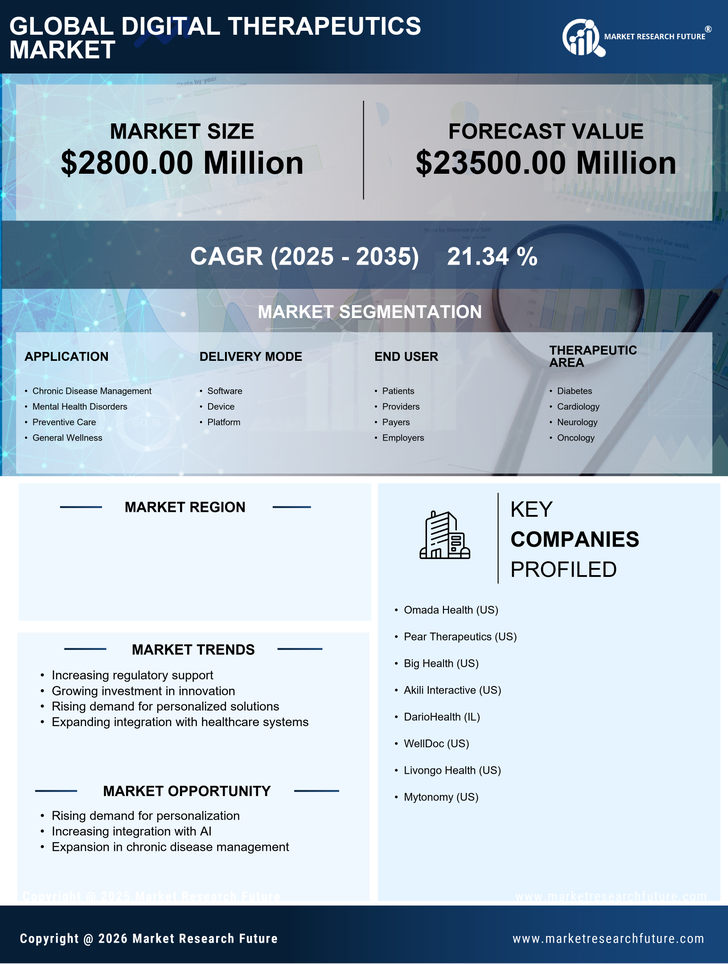
- Chronic Disease Management
- Mental Health Disorders
- Preventive Care
- General Wellness
Industrial Automation & Equipment By Delivery Mode (USD Million, 2025-2035)
- Software
- Device
- Platform
Industrial Automation & Equipment By End User (USD Million, 2025-2035)
- Patients
- Providers
- Payers
- Employers
Industrial Automation & Equipment By Therapeutic Area (USD Million, 2025-2035)
- Diabetes
- Cardiology
- Neurology
- Oncology