US CubeSat Market

ID: MRFR/AD/16156-HCR
100 Pages
Abbas Raut
Last Updated: April 06, 2026
US Cubesat Market Size, Share, Industry Trend & Analysis Research Report: By Size (0.25U to 1U, 1 to 3U, 3U to 6U, 6U to 12U, 12U & above), By Application (earth observation & traffic monitoring, science technology and education, space observation, communication, others), By Subsystem (payloads, structures, electrical power systems, command and data handling, propulsion systems, attitude determination and control systems, others) and By End User (government and military, commercial and non-profit organizations) - Forecast to 2035.
Download PDF ×

We do not share your information with anyone. However, we may send you emails based on your report interest from time to time. You may contact us at any time to opt-out.

US CubeSat Market

Market Size

Forecast Period2025 - 2035
CAGR (2025 - 2035)4.64%
2024 Market Size$ 136.63 Million
2025 Market Size$ 142.97 Million
2035 Market Size$ 225 Million

Key Players

Planet Labs
Spire Global
AeroVironment
Blue Canyon Technologies
Tyvak Nano-Satellite Systems
ISISpace
Opportunities
  • Rising Commercial Investments
  • Growing Demand for Data Analytics
  • Government Initiatives and Funding
  1. 1 SECTION I: EXECUTIVE SUMMARY AND KEY HIGHLIGHTS
    1. 1.1 EXECUTIVE SUMMARY
      1. 1.1.1 Market Overview
      2. 1.1.2 Key Findings
      3. 1.1.3 Market Segmentation
      4. 1.1.4 Competitive Landscape
      5. 1.1.5 Challenges and Opportunities
      6. 1.1.6 Future Outlook
  2. 2 SECTION II: SCOPING, METHODOLOGY AND MARKET STRUCTURE
    1. 2.1 MARKET INTRODUCTION
      1. 2.1.1 Definition
      2. 2.1.2 Scope of the study
        1. 2.1.2.1 Research Objective
        2. 2.1.2.2 Assumption
        3. 2.1.2.3 Limitations
    2. 2.2 RESEARCH METHODOLOGY
      1. 2.2.1 Overview
      2. 2.2.2 Data Mining
      3. 2.2.3 Secondary Research
      4. 2.2.4 Primary Research
        1. 2.2.4.1 Primary Interviews and Information Gathering Process
        2. 2.2.4.2 Breakdown of Primary Respondents
      5. 2.2.5 Forecasting Model
      6. 2.2.6 Market Size Estimation
        1. 2.2.6.1 Bottom-Up Approach
        2. 2.2.6.2 Top-Down Approach
      7. 2.2.7 Data Triangulation
      8. 2.2.8 Validation
  3. 3 SECTION III: QUALITATIVE ANALYSIS
    1. 3.1 MARKET DYNAMICS
      1. 3.1.1 Overview
      2. 3.1.2 Drivers
      3. 3.1.3 Restraints
      4. 3.1.4 Opportunities
    2. 3.2 MARKET FACTOR ANALYSIS
      1. 3.2.1 Value chain Analysis
      2. 3.2.2 Porter's Five Forces Analysis
        1. 3.2.2.1 Bargaining Power of Suppliers
        2. 3.2.2.2 Bargaining Power of Buyers
        3. 3.2.2.3 Threat of New Entrants
        4. 3.2.2.4 Threat of Substitutes
        5. 3.2.2.5 Intensity of Rivalry
      3. 3.2.3 COVID-19 Impact Analysis
        1. 3.2.3.1 Market Impact Analysis
        2. 3.2.3.2 Regional Impact
        3. 3.2.3.3 Opportunity and Threat Analysis
  4. 4 SECTION IV: QUANTITATIVE ANALYSIS
    1. 4.1 Industrial Automation & Equipment, BY Size (USD Million)
      1. 4.1.1 0.25U to 1U
      2. 4.1.2 1 to 3U
      3. 4.1.3 3U to 6U
      4. 4.1.4 6U to 12U
      5. 4.1.5 12U & above
    2. 4.2 Industrial Automation & Equipment, BY Application (USD Million)
      1. 4.2.1 Earth Observation & Traffic Monitoring
      2. 4.2.2 Science Technology and Education
      3. 4.2.3 Space Observation
      4. 4.2.4 Communication
      5. 4.2.5 Others
    3. 4.3 Industrial Automation & Equipment, BY Subsystem (USD Million)
      1. 4.3.1 Payloads
      2. 4.3.2 Structures
      3. 4.3.3 Electrical Power Systems
      4. 4.3.4 Command and Data Handling
      5. 4.3.5 Propulsion Systems
      6. 4.3.6 Attitude Determination and Control Systems
      7. 4.3.7 Others
    4. 4.4 Industrial Automation & Equipment, BY End-user (USD Million)
      1. 4.4.1 Government and Military
      2. 4.4.2 Commercial
      3. 4.4.3 Non-Profit Organizations
  5. 5 SECTION V: COMPETITIVE ANALYSIS
    1. 5.1 Competitive Landscape
      1. 5.1.1 Overview
      2. 5.1.2 Competitive Analysis
      3. 5.1.3 Market share Analysis
      4. 5.1.4 Major Growth Strategy in the Industrial Automation & Equipment
      5. 5.1.5 Competitive Benchmarking
      6. 5.1.6 Leading Players in Terms of Number of Developments in the Industrial Automation & Equipment
      7. 5.1.7 Key developments and growth strategies
        1. 5.1.7.1 New Product Launch/Service Deployment
        2. 5.1.7.2 Merger & Acquisitions
        3. 5.1.7.3 Joint Ventures
      8. 5.1.8 Major Players Financial Matrix
        1. 5.1.8.1 Sales and Operating Income
        2. 5.1.8.2 Major Players R&D Expenditure. 2023
    2. 5.2 Company Profiles
      1. 5.2.1 Planet Labs (US)
        1. 5.2.1.1 Financial Overview
        2. 5.2.1.2 Products Offered
        3. 5.2.1.3 Key Developments
        4. 5.2.1.4 SWOT Analysis
        5. 5.2.1.5 Key Strategies
      2. 5.2.2 Spire Global (US)
        1. 5.2.2.1 Financial Overview
        2. 5.2.2.2 Products Offered
        3. 5.2.2.3 Key Developments
        4. 5.2.2.4 SWOT Analysis
        5. 5.2.2.5 Key Strategies
      3. 5.2.3 AeroVironment (US)
        1. 5.2.3.1 Financial Overview
        2. 5.2.3.2 Products Offered
        3. 5.2.3.3 Key Developments
        4. 5.2.3.4 SWOT Analysis
        5. 5.2.3.5 Key Strategies
      4. 5.2.4 Blue Canyon Technologies (US)
        1. 5.2.4.1 Financial Overview
        2. 5.2.4.2 Products Offered
        3. 5.2.4.3 Key Developments
        4. 5.2.4.4 SWOT Analysis
        5. 5.2.4.5 Key Strategies
      5. 5.2.5 Tyvak Nano-Satellite Systems (US)
        1. 5.2.5.1 Financial Overview
        2. 5.2.5.2 Products Offered
        3. 5.2.5.3 Key Developments
        4. 5.2.5.4 SWOT Analysis
        5. 5.2.5.5 Key Strategies
      6. 5.2.6 ISISpace (NL)
        1. 5.2.6.1 Financial Overview
        2. 5.2.6.2 Products Offered
        3. 5.2.6.3 Key Developments
        4. 5.2.6.4 SWOT Analysis
        5. 5.2.6.5 Key Strategies
      7. 5.2.7 GomSpace (DK)
        1. 5.2.7.1 Financial Overview
        2. 5.2.7.2 Products Offered
        3. 5.2.7.3 Key Developments
        4. 5.2.7.4 SWOT Analysis
        5. 5.2.7.5 Key Strategies
      8. 5.2.8 NanoAvionics (LT)
        1. 5.2.8.1 Financial Overview
        2. 5.2.8.2 Products Offered
        3. 5.2.8.3 Key Developments
        4. 5.2.8.4 SWOT Analysis
        5. 5.2.8.5 Key Strategies
    3. 5.3 Appendix
      1. 5.3.1 References
      2. 5.3.2 Related Reports
  6. 6 LIST OF FIGURES
    1. 6.1 MARKET SYNOPSIS
    2. 6.2 US MARKET ANALYSIS BY SIZE
    3. 6.3 US MARKET ANALYSIS BY APPLICATION
    4. 6.4 US MARKET ANALYSIS BY SUBSYSTEM
    5. 6.5 US MARKET ANALYSIS BY END-USER
    6. 6.6 KEY BUYING CRITERIA OF INDUSTRIAL AUTOMATION & EQUIPMENT
    7. 6.7 RESEARCH PROCESS OF MRFR
    8. 6.8 DRO ANALYSIS OF INDUSTRIAL AUTOMATION & EQUIPMENT
    9. 6.9 DRIVERS IMPACT ANALYSIS: INDUSTRIAL AUTOMATION & EQUIPMENT
    10. 6.10 RESTRAINTS IMPACT ANALYSIS: INDUSTRIAL AUTOMATION & EQUIPMENT
    11. 6.11 SUPPLY / VALUE CHAIN: INDUSTRIAL AUTOMATION & EQUIPMENT
    12. 6.12 INDUSTRIAL AUTOMATION & EQUIPMENT, BY SIZE, 2024 (% SHARE)
    13. 6.13 INDUSTRIAL AUTOMATION & EQUIPMENT, BY SIZE, 2024 TO 2035 (USD Million)
    14. 6.14 INDUSTRIAL AUTOMATION & EQUIPMENT, BY APPLICATION, 2024 (% SHARE)
    15. 6.15 INDUSTRIAL AUTOMATION & EQUIPMENT, BY APPLICATION, 2024 TO 2035 (USD Million)
    16. 6.16 INDUSTRIAL AUTOMATION & EQUIPMENT, BY SUBSYSTEM, 2024 (% SHARE)
    17. 6.17 INDUSTRIAL AUTOMATION & EQUIPMENT, BY SUBSYSTEM, 2024 TO 2035 (USD Million)
    18. 6.18 INDUSTRIAL AUTOMATION & EQUIPMENT, BY END-USER, 2024 (% SHARE)
    19. 6.19 INDUSTRIAL AUTOMATION & EQUIPMENT, BY END-USER, 2024 TO 2035 (USD Million)
    20. 6.20 BENCHMARKING OF MAJOR COMPETITORS
  7. 7 LIST OF TABLES
    1. 7.1 LIST OF ASSUMPTIONS
  8. 7.1.1
    1. 7.2 US MARKET SIZE ESTIMATES; FORECAST
      1. 7.2.1 BY SIZE, 2025-2035 (USD Million)
      2. 7.2.2 BY APPLICATION, 2025-2035 (USD Million)
      3. 7.2.3 BY SUBSYSTEM, 2025-2035 (USD Million)
      4. 7.2.4 BY END-USER, 2025-2035 (USD Million)
    2. 7.3 PRODUCT LAUNCH/PRODUCT DEVELOPMENT/APPROVAL
  9. 7.3.1
    1. 7.4 ACQUISITION/PARTNERSHIP
  10. 7.4.1

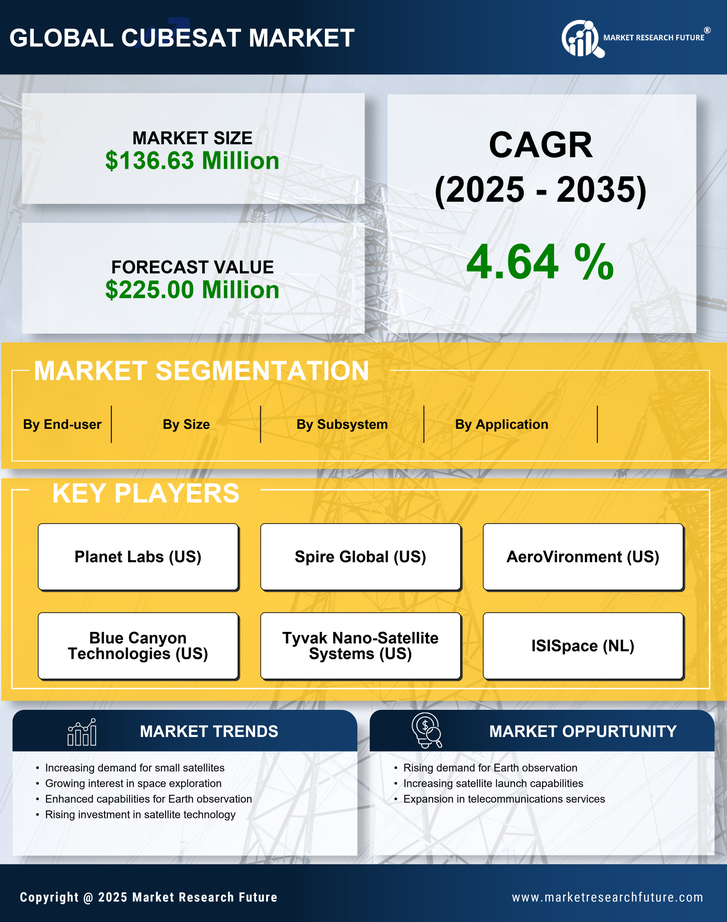
US Industrial Automation & Equipment Market Segmentation

Industrial Automation & Equipment By Size (USD Million, 2025-2035)

  • 0.25U to 1U
  • 1 to 3U
  • 3U to 6U
  • 6U to 12U
  • 12U & above

Industrial Automation & Equipment By Application (USD Million, 2025-2035)

  • Earth Observation & Traffic Monitoring
  • Science Technology and Education
  • Space Observation
  • Communication
  • Others

Industrial Automation & Equipment By Subsystem (USD Million, 2025-2035)

  • Payloads
  • Structures
  • Electrical Power Systems
  • Command and Data Handling
  • Propulsion Systems
  • Attitude Determination and Control Systems
  • Others

Industrial Automation & Equipment By End-user (USD Million, 2025-2035)

  • Government and Military
  • Commercial
  • Non-Profit Organizations