US CRM Analytics Market Segmentation
US CRM Analytics Market By Type (USD Million, 2025-2035)
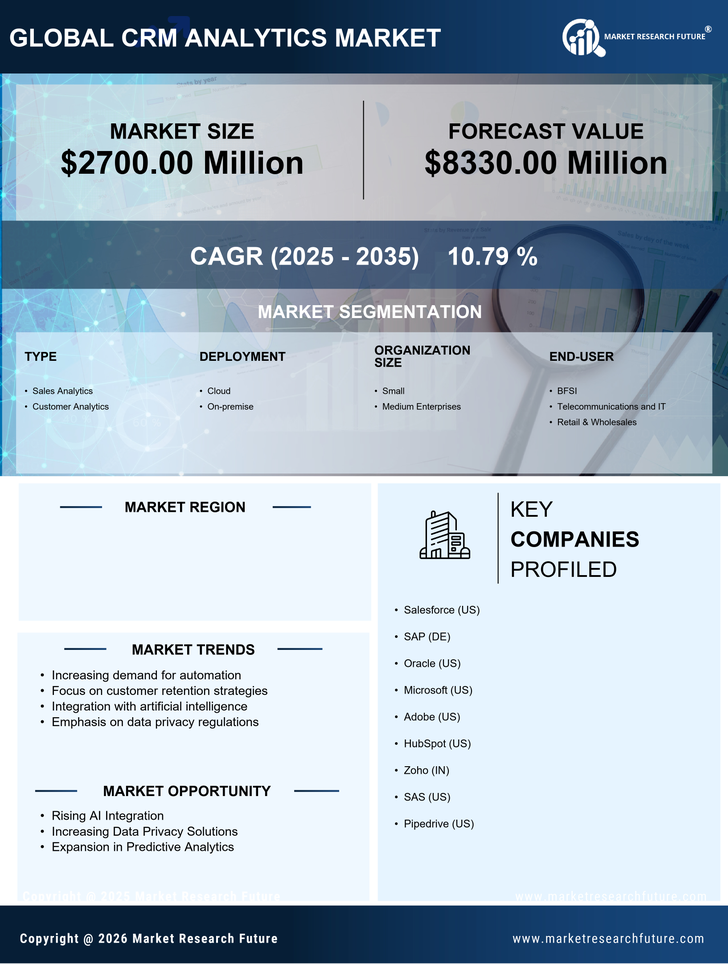
- Sales Analytics
- Customer Analytics
US CRM Analytics Market By Deployment (USD Million, 2025-2035)
- Cloud
- On-premise
US CRM Analytics Market By Organization Size (USD Million, 2025-2035)
- Small
- Medium Enterprises
US CRM Analytics Market By End-User (USD Million, 2025-2035)
- BFSI
- Telecommunications and IT
- Retail & Wholesales