US Crab Market Segmentation
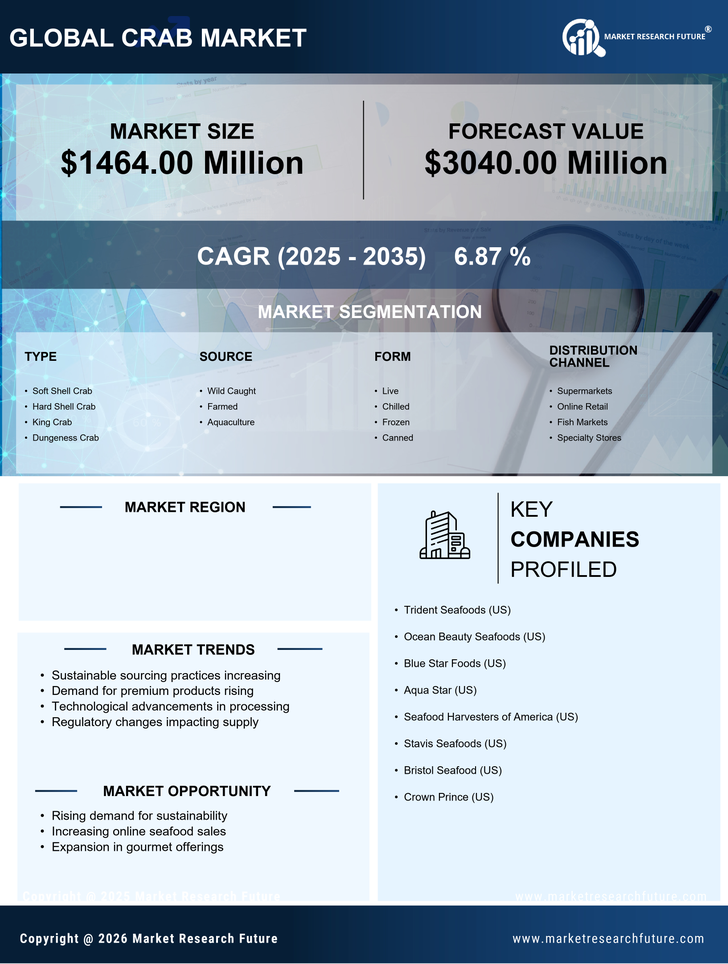
US Crab Market By Type (USD Million, 2025-2035)
- Soft Shell Crab
- Hard Shell Crab
- King Crab
- Dungeness Crab
US Crab Market By Source (USD Million, 2025-2035)
- Wild Caught
- Farmed
- Aquaculture
US Crab Market By Form (USD Million, 2025-2035)
- Live
- Chilled
- Frozen
- Canned
US Crab Market By Distribution Channel (USD Million, 2025-2035)
- Supermarkets
- Online Retail
- Fish Markets
- Specialty Stores