US Biodegradable Packaging Market Segmentation
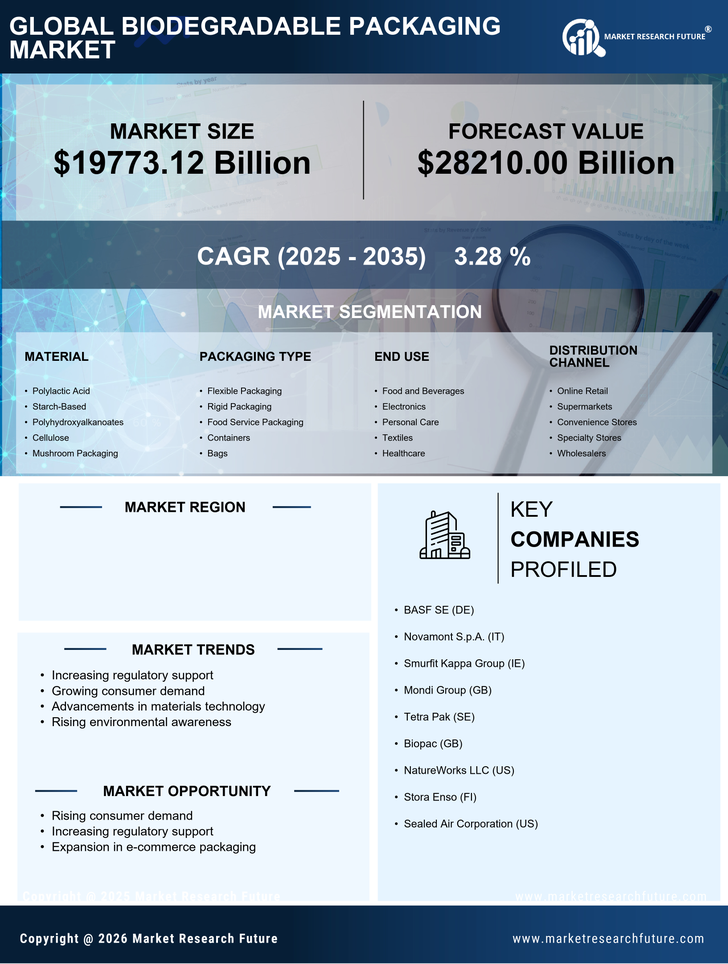
US Biodegradable Packaging Market By Material (USD Billion, 2025-2035)
- Polylactic Acid
- Starch-Based
- Polyhydroxyalkanoates
- Cellulose
- Mushroom Packaging
US Biodegradable Packaging Market By Packaging Type (USD Billion, 2025-2035)
- Flexible Packaging
- Rigid Packaging
- Food Service Packaging
- Containers
- Bags
US Biodegradable Packaging Market By End Use (USD Billion, 2025-2035)
- Food and Beverages
- Electronics
- Personal Care
- Textiles
- Healthcare
US Biodegradable Packaging Market By Distribution Channel (USD Billion, 2025-2035)
- Online Retail
- Supermarkets
- Convenience Stores
- Specialty Stores
- Wholesalers