Request Free Sample ×

Kindly complete the form below to receive a free sample of this Report

* Please use a valid business email

Leading companies partner with us for data-driven Insights

clients tt-cursor
Hero Background

US Autonomous Emergency Braking System Market

ID: MRFR/AT/14386-HCR
100 Pages
Triveni Bhoyar
Last Updated: April 06, 2026

US Autonomous Emergency Braking System Market Research Report: By Application (Passenger Vehicles, Commercial Vehicles, Motorcycles, Heavy Trucks), By Sensor Technology (Radar, Lidar, Camera, Ultrasonic), By Component Type (Electronic Control Unit, Sensors, Actuators, Other Components) and By End Use (Private Use, Fleet Management, Public Transport) - Forecast to 2035

Share:
Download PDF ×

We do not share your information with anyone. However, we may send you emails based on your report interest from time to time. You may contact us at any time to opt-out.

  1. 1 SECTION I: EXECUTIVE SUMMARY AND KEY HIGHLIGHTS
    1. 1.1 EXECUTIVE SUMMARY
      1. 1.1.1 Market Overview
      2. 1.1.2 Key Findings
      3. 1.1.3 Market Segmentation
      4. 1.1.4 Competitive Landscape
      5. 1.1.5 Challenges and Opportunities
      6. 1.1.6 Future Outlook
  2. 2 SECTION II: SCOPING, METHODOLOGY AND MARKET STRUCTURE
    1. 2.1 MARKET INTRODUCTION
      1. 2.1.1 Definition
      2. 2.1.2 Scope of the study
        1. 2.1.2.1 Research Objective
        2. 2.1.2.2 Assumption
        3. 2.1.2.3 Limitations
    2. 2.2 RESEARCH METHODOLOGY
      1. 2.2.1 Overview
      2. 2.2.2 Data Mining
      3. 2.2.3 Secondary Research
      4. 2.2.4 Primary Research
        1. 2.2.4.1 Primary Interviews and Information Gathering Process
        2. 2.2.4.2 Breakdown of Primary Respondents
      5. 2.2.5 Forecasting Model
      6. 2.2.6 Market Size Estimation
        1. 2.2.6.1 Bottom-Up Approach
        2. 2.2.6.2 Top-Down Approach
      7. 2.2.7 Data Triangulation
      8. 2.2.8 Validation
  3. 3 SECTION III: QUALITATIVE ANALYSIS
    1. 3.1 MARKET DYNAMICS
      1. 3.1.1 Overview
      2. 3.1.2 Drivers
      3. 3.1.3 Restraints
      4. 3.1.4 Opportunities
    2. 3.2 MARKET FACTOR ANALYSIS
      1. 3.2.1 Value chain Analysis
      2. 3.2.2 Porter's Five Forces Analysis
        1. 3.2.2.1 Bargaining Power of Suppliers
        2. 3.2.2.2 Bargaining Power of Buyers
        3. 3.2.2.3 Threat of New Entrants
        4. 3.2.2.4 Threat of Substitutes
        5. 3.2.2.5 Intensity of Rivalry
      3. 3.2.3 COVID-19 Impact Analysis
        1. 3.2.3.1 Market Impact Analysis
        2. 3.2.3.2 Regional Impact
        3. 3.2.3.3 Opportunity and Threat Analysis
  4. 4 SECTION IV: QUANTITATIVE ANALYSIS
    1. 4.1 Automobile, BY Application (USD Million)
      1. 4.1.1 Passenger Vehicles
      2. 4.1.2 Commercial Vehicles
      3. 4.1.3 Motorcycles
      4. 4.1.4 Heavy Trucks
    2. 4.2 Automobile, BY Sensor Technology (USD Million)
      1. 4.2.1 Radar
      2. 4.2.2 Lidar
      3. 4.2.3 Camera
      4. 4.2.4 Ultrasonic
    3. 4.3 Automobile, BY Component Type (USD Million)
      1. 4.3.1 Electronic Control Unit
      2. 4.3.2 Sensors
      3. 4.3.3 Actuators
      4. 4.3.4 Other Components
    4. 4.4 Automobile, BY End Use (USD Million)
      1. 4.4.1 Private Use
      2. 4.4.2 Fleet Management
      3. 4.4.3 Public Transport
  5. 5 SECTION V: COMPETITIVE ANALYSIS
    1. 5.1 Competitive Landscape
      1. 5.1.1 Overview
      2. 5.1.2 Competitive Analysis
      3. 5.1.3 Market share Analysis
      4. 5.1.4 Major Growth Strategy in the Automobile
      5. 5.1.5 Competitive Benchmarking
      6. 5.1.6 Leading Players in Terms of Number of Developments in the Automobile
      7. 5.1.7 Key developments and growth strategies
        1. 5.1.7.1 New Product Launch/Service Deployment
        2. 5.1.7.2 Merger & Acquisitions
        3. 5.1.7.3 Joint Ventures
      8. 5.1.8 Major Players Financial Matrix
        1. 5.1.8.1 Sales and Operating Income
        2. 5.1.8.2 Major Players R&D Expenditure. 2023
    2. 5.2 Company Profiles
      1. 5.2.1 Bosch (DE)
        1. 5.2.1.1 Financial Overview
        2. 5.2.1.2 Products Offered
        3. 5.2.1.3 Key Developments
        4. 5.2.1.4 SWOT Analysis
        5. 5.2.1.5 Key Strategies
      2. 5.2.2 Continental (DE)
        1. 5.2.2.1 Financial Overview
        2. 5.2.2.2 Products Offered
        3. 5.2.2.3 Key Developments
        4. 5.2.2.4 SWOT Analysis
        5. 5.2.2.5 Key Strategies
      3. 5.2.3 Denso (JP)
        1. 5.2.3.1 Financial Overview
        2. 5.2.3.2 Products Offered
        3. 5.2.3.3 Key Developments
        4. 5.2.3.4 SWOT Analysis
        5. 5.2.3.5 Key Strategies
      4. 5.2.4 Aisin Seiki (JP)
        1. 5.2.4.1 Financial Overview
        2. 5.2.4.2 Products Offered
        3. 5.2.4.3 Key Developments
        4. 5.2.4.4 SWOT Analysis
        5. 5.2.4.5 Key Strategies
      5. 5.2.5 ZF Friedrichshafen (DE)
        1. 5.2.5.1 Financial Overview
        2. 5.2.5.2 Products Offered
        3. 5.2.5.3 Key Developments
        4. 5.2.5.4 SWOT Analysis
        5. 5.2.5.5 Key Strategies
      6. 5.2.6 Magna International (CA)
        1. 5.2.6.1 Financial Overview
        2. 5.2.6.2 Products Offered
        3. 5.2.6.3 Key Developments
        4. 5.2.6.4 SWOT Analysis
        5. 5.2.6.5 Key Strategies
      7. 5.2.7 Valeo (FR)
        1. 5.2.7.1 Financial Overview
        2. 5.2.7.2 Products Offered
        3. 5.2.7.3 Key Developments
        4. 5.2.7.4 SWOT Analysis
        5. 5.2.7.5 Key Strategies
      8. 5.2.8 Nissan (JP)
        1. 5.2.8.1 Financial Overview
        2. 5.2.8.2 Products Offered
        3. 5.2.8.3 Key Developments
        4. 5.2.8.4 SWOT Analysis
        5. 5.2.8.5 Key Strategies
      9. 5.2.9 Hyundai Mobis (KR)
        1. 5.2.9.1 Financial Overview
        2. 5.2.9.2 Products Offered
        3. 5.2.9.3 Key Developments
        4. 5.2.9.4 SWOT Analysis
        5. 5.2.9.5 Key Strategies
    3. 5.3 Appendix
      1. 5.3.1 References
      2. 5.3.2 Related Reports
  6. 6 LIST OF FIGURES
    1. 6.1 MARKET SYNOPSIS
    2. 6.2 US MARKET ANALYSIS BY APPLICATION
    3. 6.3 US MARKET ANALYSIS BY SENSOR TECHNOLOGY
    4. 6.4 US MARKET ANALYSIS BY COMPONENT TYPE
    5. 6.5 US MARKET ANALYSIS BY END USE
    6. 6.6 KEY BUYING CRITERIA OF AUTOMOBILE
    7. 6.7 RESEARCH PROCESS OF MRFR
    8. 6.8 DRO ANALYSIS OF AUTOMOBILE
    9. 6.9 DRIVERS IMPACT ANALYSIS: AUTOMOBILE
    10. 6.10 RESTRAINTS IMPACT ANALYSIS: AUTOMOBILE
    11. 6.11 SUPPLY / VALUE CHAIN: AUTOMOBILE
    12. 6.12 AUTOMOBILE, BY APPLICATION, 2024 (% SHARE)
    13. 6.13 AUTOMOBILE, BY APPLICATION, 2024 TO 2035 (USD Million)
    14. 6.14 AUTOMOBILE, BY SENSOR TECHNOLOGY, 2024 (% SHARE)
    15. 6.15 AUTOMOBILE, BY SENSOR TECHNOLOGY, 2024 TO 2035 (USD Million)
    16. 6.16 AUTOMOBILE, BY COMPONENT TYPE, 2024 (% SHARE)
    17. 6.17 AUTOMOBILE, BY COMPONENT TYPE, 2024 TO 2035 (USD Million)
    18. 6.18 AUTOMOBILE, BY END USE, 2024 (% SHARE)
    19. 6.19 AUTOMOBILE, BY END USE, 2024 TO 2035 (USD Million)
    20. 6.20 BENCHMARKING OF MAJOR COMPETITORS
  7. 7 LIST OF TABLES
    1. 7.1 LIST OF ASSUMPTIONS
  8. 7.1.1
    1. 7.2 US MARKET SIZE ESTIMATES; FORECAST
      1. 7.2.1 BY APPLICATION, 2025-2035 (USD Million)
      2. 7.2.2 BY SENSOR TECHNOLOGY, 2025-2035 (USD Million)
      3. 7.2.3 BY COMPONENT TYPE, 2025-2035 (USD Million)
      4. 7.2.4 BY END USE, 2025-2035 (USD Million)
    2. 7.3 PRODUCT LAUNCH/PRODUCT DEVELOPMENT/APPROVAL
  9. 7.3.1
    1. 7.4 ACQUISITION/PARTNERSHIP
  10. 7.4.1

US Automobile Market Segmentation

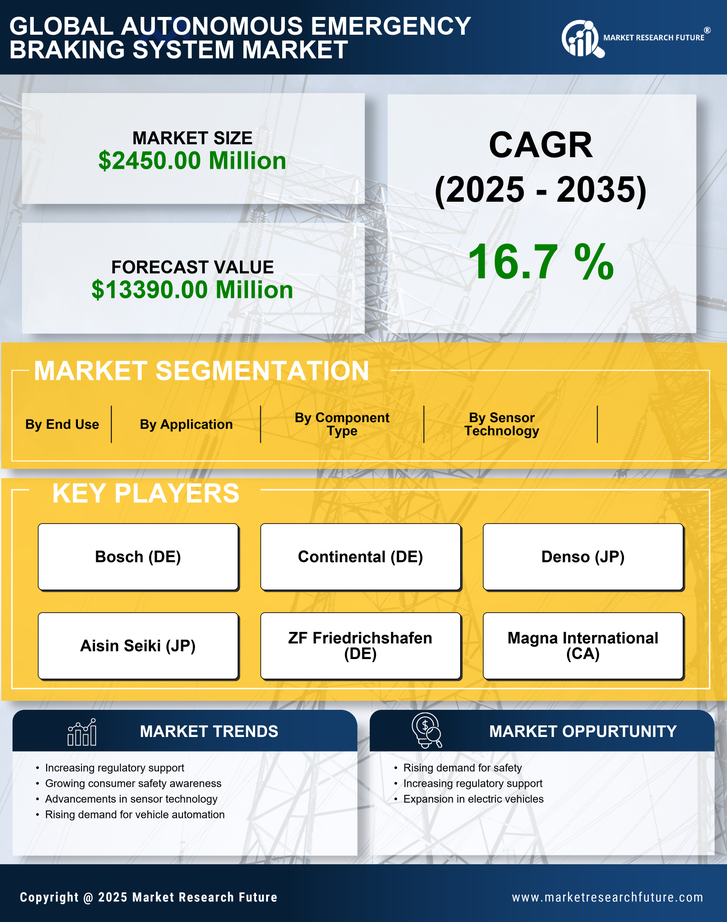
Automobile By Application (USD Million, 2025-2035)

  • Passenger Vehicles
  • Commercial Vehicles
  • Motorcycles
  • Heavy Trucks

Automobile By Sensor Technology (USD Million, 2025-2035)

  • Radar
  • Lidar
  • Camera
  • Ultrasonic

Automobile By Component Type (USD Million, 2025-2035)

  • Electronic Control Unit
  • Sensors
  • Actuators
  • Other Components

Automobile By End Use (USD Million, 2025-2035)

  • Private Use
  • Fleet Management
  • Public Transport

Compare Licence

×
Features License Type
Single User Multiuser License Enterprise User
Price $4,950 $5,950 $7,250
Maximum User Access Limit 1 User Upto 10 Users Unrestricted Access Throughout the Organization
Free Customization
Direct Access to Analyst
Deliverable Format
Platform Access
Discount on Next Purchase 10% 15% 15%
Printable Versions