Request Free Sample ×

Kindly complete the form below to receive a free sample of this Report

* Please use a valid business email

Leading companies partner with us for data-driven Insights

clients tt-cursor
Hero Background

US Automotive Stamping Market

ID: MRFR/AT/15106-HCR
100 Pages
Shubham Munde
Last Updated: April 06, 2026

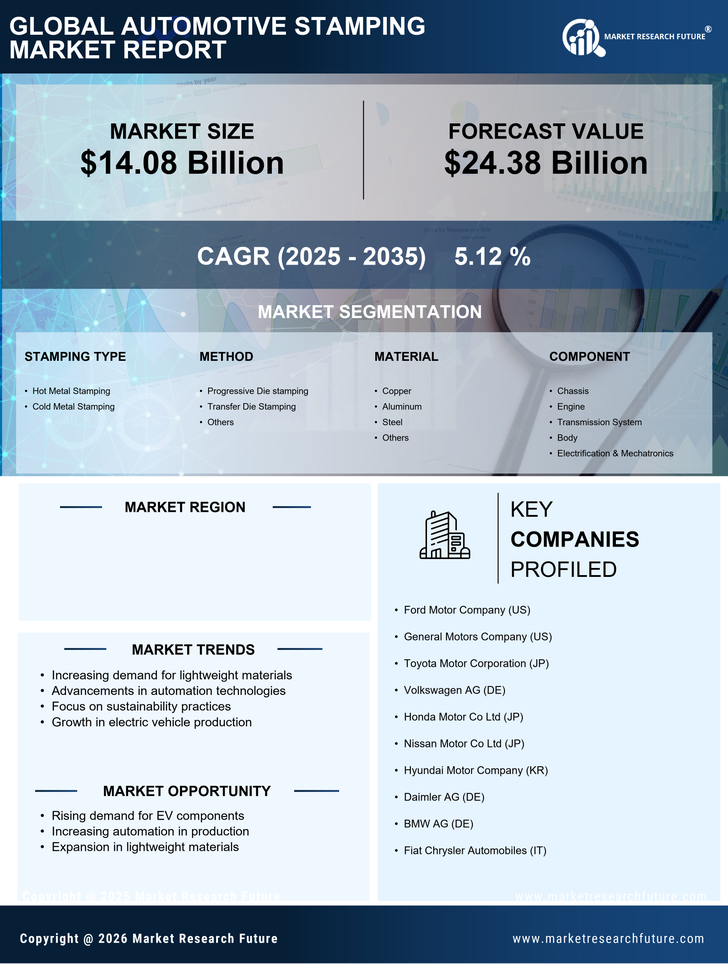
US Automotive Stamping Market Research Report By Method (Progressive Die stamping, Transfer Die Stamping, Others), By End User (OEM, Tier Automotive Manufacturer), By Material (Copper, Aluminum, Steel, Others), By Component (Chassis, Engine, Transmission System, Body, Electrification & Mechatronics), By Vehicle Type (Passenger Cars, Commercial Vehicles, Offroad Vehicles, Two Wheelers, Others), By Stamping Type (Hot Metal Stamping, Cold Metal Stamping, Vehicle Category Outlook, ICE, Electric) - Forecast to 2035

Share:
Download PDF ×

We do not share your information with anyone. However, we may send you emails based on your report interest from time to time. You may contact us at any time to opt-out.

US Automotive Stamping Market Infographic
Purchase Options
  1. 1 SECTION I: EXECUTIVE SUMMARY AND KEY HIGHLIGHTS
  2.   1.1 EXECUTIVE SUMMARY
  3.     1.1.1 Market Overview
  4.     1.1.2 Key Findings
  5.     1.1.3 Market Segmentation
  6.     1.1.4 Competitive Landscape
  7.     1.1.5 Challenges and Opportunities
  8.     1.1.6 Future Outlook
  9. 2 SECTION II: SCOPING, METHODOLOGY AND MARKET STRUCTURE
  10.   2.1 MARKET INTRODUCTION
  11.     2.1.1 Definition
  12.     2.1.2 Scope of the study
  13.       2.1.2.1 Research Objective
  14.       2.1.2.2 Assumption
  15.       2.1.2.3 Limitations
  16.   2.2 RESEARCH METHODOLOGY
  17.     2.2.1 Overview
  18.     2.2.2 Data Mining
  19.     2.2.3 Secondary Research
  20.     2.2.4 Primary Research
  21.       2.2.4.1 Primary Interviews and Information Gathering Process
  22.       2.2.4.2 Breakdown of Primary Respondents
  23.     2.2.5 Forecasting Model
  24.     2.2.6 Market Size Estimation
  25.       2.2.6.1 Bottom-Up Approach
  26.       2.2.6.2 Top-Down Approach
  27.     2.2.7 Data Triangulation
  28.     2.2.8 Validation
  29. 3 SECTION III: QUALITATIVE ANALYSIS
  30.   3.1 MARKET DYNAMICS
  31.     3.1.1 Overview
  32.     3.1.2 Drivers
  33.     3.1.3 Restraints
  34.     3.1.4 Opportunities
  35.   3.2 MARKET FACTOR ANALYSIS
  36.     3.2.1 Value chain Analysis
  37.     3.2.2 Porter's Five Forces Analysis
  38.       3.2.2.1 Bargaining Power of Suppliers
  39.       3.2.2.2 Bargaining Power of Buyers
  40.       3.2.2.3 Threat of New Entrants
  41.       3.2.2.4 Threat of Substitutes
  42.       3.2.2.5 Intensity of Rivalry
  43.     3.2.3 COVID-19 Impact Analysis
  44.       3.2.3.1 Market Impact Analysis
  45.       3.2.3.2 Regional Impact
  46.       3.2.3.3 Opportunity and Threat Analysis
  47. 4 SECTION IV: QUANTITATIVE ANALYSIS
  48.   4.1 Automobile, BY Stamping Type (USD Billion)
  49.     4.1.1 Hot Metal Stamping
  50.     4.1.2 Cold Metal Stamping
  51.   4.2 Automobile, BY Method (USD Billion)
  52.     4.2.1 Progressive Die stamping
  53.     4.2.2 Transfer Die Stamping
  54.     4.2.3 Others
  55.   4.3 Automobile, BY Material (USD Billion)
  56.     4.3.1 Copper
  57.     4.3.2 Aluminum
  58.     4.3.3 Steel
  59.     4.3.4 Others
  60.   4.4 Automobile, BY Component (USD Billion)
  61.     4.4.1 Chassis
  62.     4.4.2 Engine
  63.     4.4.3 Transmission System
  64.     4.4.4 Body
  65.     4.4.5 Electrification & Mechatronics
  66.   4.5 Automobile, BY Vehicle Type (USD Billion)
  67.     4.5.1 Passenger Cars
  68.     4.5.2 Commercial Vehicles
  69.     4.5.3 Offroad Vehicles
  70.     4.5.4 Two Wheelers
  71.     4.5.5 Others
  72.   4.6 Automobile, BY Vehicle Category (USD Billion)
  73.     4.6.1 ICE
  74.     4.6.2 Electric
  75.   4.7 Automobile, BY End User (USD Billion)
  76.     4.7.1 OEM
  77.     4.7.2 Tier Automotive Manufacturer
  78. 5 SECTION V: COMPETITIVE ANALYSIS
  79.   5.1 Competitive Landscape
  80.     5.1.1 Overview
  81.     5.1.2 Competitive Analysis
  82.     5.1.3 Market share Analysis
  83.     5.1.4 Major Growth Strategy in the Automobile
  84.     5.1.5 Competitive Benchmarking
  85.     5.1.6 Leading Players in Terms of Number of Developments in the Automobile
  86.     5.1.7 Key developments and growth strategies
  87.       5.1.7.1 New Product Launch/Service Deployment
  88.       5.1.7.2 Merger & Acquisitions
  89.       5.1.7.3 Joint Ventures
  90.     5.1.8 Major Players Financial Matrix
  91.       5.1.8.1 Sales and Operating Income
  92.       5.1.8.2 Major Players R&D Expenditure. 2023
  93.   5.2 Company Profiles
  94.     5.2.1 Ford Motor Company (US)
  95.       5.2.1.1 Financial Overview
  96.       5.2.1.2 Products Offered
  97.       5.2.1.3 Key Developments
  98.       5.2.1.4 SWOT Analysis
  99.       5.2.1.5 Key Strategies
  100.     5.2.2 General Motors Company (US)
  101.       5.2.2.1 Financial Overview
  102.       5.2.2.2 Products Offered
  103.       5.2.2.3 Key Developments
  104.       5.2.2.4 SWOT Analysis
  105.       5.2.2.5 Key Strategies
  106.     5.2.3 Toyota Motor Corporation (JP)
  107.       5.2.3.1 Financial Overview
  108.       5.2.3.2 Products Offered
  109.       5.2.3.3 Key Developments
  110.       5.2.3.4 SWOT Analysis
  111.       5.2.3.5 Key Strategies
  112.     5.2.4 Volkswagen AG (DE)
  113.       5.2.4.1 Financial Overview
  114.       5.2.4.2 Products Offered
  115.       5.2.4.3 Key Developments
  116.       5.2.4.4 SWOT Analysis
  117.       5.2.4.5 Key Strategies
  118.     5.2.5 Honda Motor Co Ltd (JP)
  119.       5.2.5.1 Financial Overview
  120.       5.2.5.2 Products Offered
  121.       5.2.5.3 Key Developments
  122.       5.2.5.4 SWOT Analysis
  123.       5.2.5.5 Key Strategies
  124.     5.2.6 Nissan Motor Co Ltd (JP)
  125.       5.2.6.1 Financial Overview
  126.       5.2.6.2 Products Offered
  127.       5.2.6.3 Key Developments
  128.       5.2.6.4 SWOT Analysis
  129.       5.2.6.5 Key Strategies
  130.     5.2.7 Hyundai Motor Company (KR)
  131.       5.2.7.1 Financial Overview
  132.       5.2.7.2 Products Offered
  133.       5.2.7.3 Key Developments
  134.       5.2.7.4 SWOT Analysis
  135.       5.2.7.5 Key Strategies
  136.     5.2.8 Daimler AG (DE)
  137.       5.2.8.1 Financial Overview
  138.       5.2.8.2 Products Offered
  139.       5.2.8.3 Key Developments
  140.       5.2.8.4 SWOT Analysis
  141.       5.2.8.5 Key Strategies
  142.     5.2.9 BMW AG (DE)
  143.       5.2.9.1 Financial Overview
  144.       5.2.9.2 Products Offered
  145.       5.2.9.3 Key Developments
  146.       5.2.9.4 SWOT Analysis
  147.       5.2.9.5 Key Strategies
  148.     5.2.10 Fiat Chrysler Automobiles (IT)
  149.       5.2.10.1 Financial Overview
  150.       5.2.10.2 Products Offered
  151.       5.2.10.3 Key Developments
  152.       5.2.10.4 SWOT Analysis
  153.       5.2.10.5 Key Strategies
  154.   5.3 Appendix
  155.     5.3.1 References
  156.     5.3.2 Related Reports
  157. 6 LIST OF FIGURES
  158.   6.1 MARKET SYNOPSIS
  159.   6.2 US MARKET ANALYSIS BY STAMPING TYPE
  160.   6.3 US MARKET ANALYSIS BY METHOD
  161.   6.4 US MARKET ANALYSIS BY MATERIAL
  162.   6.5 US MARKET ANALYSIS BY COMPONENT
  163.   6.6 US MARKET ANALYSIS BY VEHICLE TYPE
  164.   6.7 US MARKET ANALYSIS BY VEHICLE CATEGORY
  165.   6.8 US MARKET ANALYSIS BY END USER
  166.   6.9 KEY BUYING CRITERIA OF AUTOMOBILE
  167.   6.10 RESEARCH PROCESS OF MRFR
  168.   6.11 DRO ANALYSIS OF AUTOMOBILE
  169.   6.12 DRIVERS IMPACT ANALYSIS: AUTOMOBILE
  170.   6.13 RESTRAINTS IMPACT ANALYSIS: AUTOMOBILE
  171.   6.14 SUPPLY / VALUE CHAIN: AUTOMOBILE
  172.   6.15 AUTOMOBILE, BY STAMPING TYPE, 2024 (% SHARE)
  173.   6.16 AUTOMOBILE, BY STAMPING TYPE, 2024 TO 2035 (USD Billion)
  174.   6.17 AUTOMOBILE, BY METHOD, 2024 (% SHARE)
  175.   6.18 AUTOMOBILE, BY METHOD, 2024 TO 2035 (USD Billion)
  176.   6.19 AUTOMOBILE, BY MATERIAL, 2024 (% SHARE)
  177.   6.20 AUTOMOBILE, BY MATERIAL, 2024 TO 2035 (USD Billion)
  178.   6.21 AUTOMOBILE, BY COMPONENT, 2024 (% SHARE)
  179.   6.22 AUTOMOBILE, BY COMPONENT, 2024 TO 2035 (USD Billion)
  180.   6.23 AUTOMOBILE, BY VEHICLE TYPE, 2024 (% SHARE)
  181.   6.24 AUTOMOBILE, BY VEHICLE TYPE, 2024 TO 2035 (USD Billion)
  182.   6.25 AUTOMOBILE, BY VEHICLE CATEGORY, 2024 (% SHARE)
  183.   6.26 AUTOMOBILE, BY VEHICLE CATEGORY, 2024 TO 2035 (USD Billion)
  184.   6.27 AUTOMOBILE, BY END USER, 2024 (% SHARE)
  185.   6.28 AUTOMOBILE, BY END USER, 2024 TO 2035 (USD Billion)
  186.   6.29 BENCHMARKING OF MAJOR COMPETITORS
  187. 7 LIST OF TABLES
  188.   7.1 LIST OF ASSUMPTIONS
  189.     7.1.1
  190.   7.2 US MARKET SIZE ESTIMATES; FORECAST
  191.     7.2.1 BY STAMPING TYPE, 2025-2035 (USD Billion)
  192.     7.2.2 BY METHOD, 2025-2035 (USD Billion)
  193.     7.2.3 BY MATERIAL, 2025-2035 (USD Billion)
  194.     7.2.4 BY COMPONENT, 2025-2035 (USD Billion)
  195.     7.2.5 BY VEHICLE TYPE, 2025-2035 (USD Billion)
  196.     7.2.6 BY VEHICLE CATEGORY, 2025-2035 (USD Billion)
  197.     7.2.7 BY END USER, 2025-2035 (USD Billion)
  198.   7.3 PRODUCT LAUNCH/PRODUCT DEVELOPMENT/APPROVAL
  199.     7.3.1
  200.   7.4 ACQUISITION/PARTNERSHIP
  201.     7.4.1

US Automobile Market Segmentation

Automobile By Stamping Type (USD Billion, 2025-2035)

  • Hot Metal Stamping
  • Cold Metal Stamping

Automobile By Method (USD Billion, 2025-2035)

  • Progressive Die stamping
  • Transfer Die Stamping
  • Others

Automobile By Material (USD Billion, 2025-2035)

  • Copper
  • Aluminum
  • Steel
  • Others

Automobile By Component (USD Billion, 2025-2035)

  • Chassis
  • Engine
  • Transmission System
  • Body
  • Electrification & Mechatronics

Automobile By Vehicle Type (USD Billion, 2025-2035)

  • Passenger Cars
  • Commercial Vehicles
  • Offroad Vehicles
  • Two Wheelers
  • Others

Automobile By Vehicle Category (USD Billion, 2025-2035)

  • ICE
  • Electric

Automobile By End User (USD Billion, 2025-2035)

  • OEM
  • Tier Automotive Manufacturer

Compare Licence

×
Features License Type
Single User Multiuser License Enterprise User
Price $4,950 $5,950 $7,250
Maximum User Access Limit 1 User Upto 10 Users Unrestricted Access Throughout the Organization
Free Customization
Direct Access to Analyst
Deliverable Format
Platform Access
Discount on Next Purchase 10% 15% 15%
Printable Versions