US Automotive HVAC Market Segmentation
US Automotive HVAC Market By Type (USD Billion, 2025-2035)
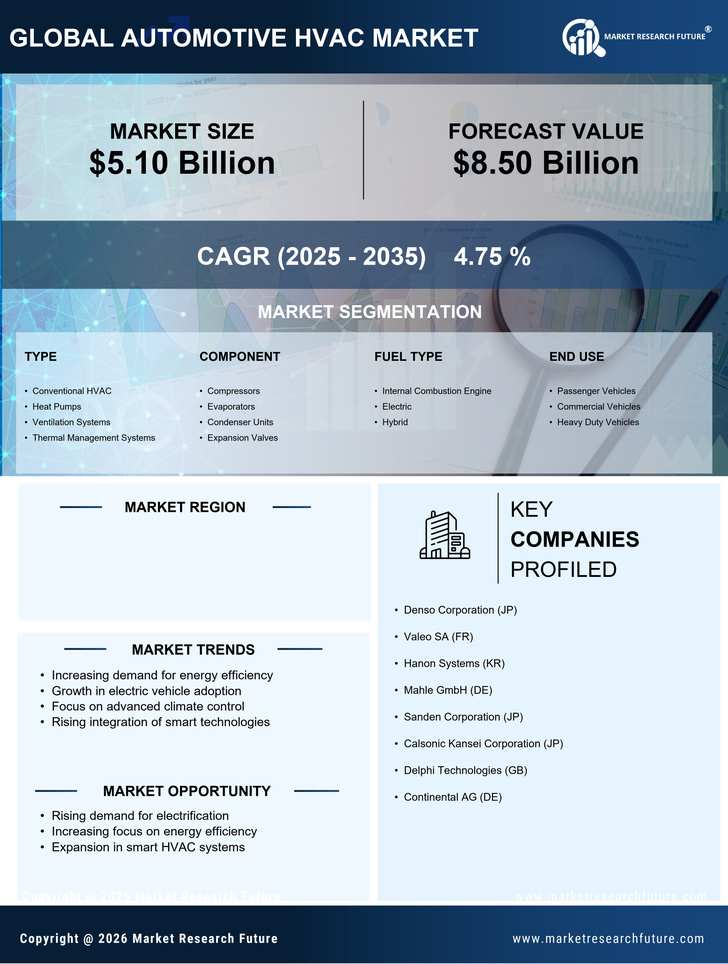
- Conventional HVAC
- Heat Pumps
- Ventilation Systems
- Thermal Management Systems
US Automotive HVAC Market By Component (USD Billion, 2025-2035)
- Compressors
- Evaporators
- Condenser Units
- Expansion Valves
US Automotive HVAC Market By Fuel Type (USD Billion, 2025-2035)
- Internal Combustion Engine
- Electric
- Hybrid
US Automotive HVAC Market By End Use (USD Billion, 2025-2035)
- Passenger Vehicles
- Commercial Vehicles
- Heavy Duty Vehicles