US Artificial Tears Market

ID: MRFR/HC/14710-HCR
100 Pages
Rahul Gotadki
Last Updated: April 06, 2026
US Artificial Tears Market Research Report By Type (Polyethylene Glycol, Propylene Glycol, Cellulose, Glycerin, Others), By Delivery Mode (Eye Drops, Ointments, Sprays), By Application (Dry Eye Syndrome, Allergies, Infections, Others) and By Distribution Channel (Hospital Pharmacies, Drug Stores, Retail Pharmacies, Online Pharmacies) - Growth & Industry Forecast 2025 To 2035
Download PDF ×

We do not share your information with anyone. However, we may send you emails based on your report interest from time to time. You may contact us at any time to opt-out.

US Artificial Tears Market

Market Size

Forecast Period2025 - 2035
CAGR (2025 - 2035)6.48%
2024 Market Size$ 919.61 Million
2025 Market Size$ 979.2 Million
2035 Market Size$ 1,835.02 Million

Key Players

Allergan
Santen Pharmaceutical
Bausch Health
Novartis
Johnson & Johnson
Alcon
Opportunities
  • Growing Awareness of Eye Health
  • Increase in Geriatric Population
  • Expansion of Distribution Channels
  1. 1 SECTION I: EXECUTIVE SUMMARY AND KEY HIGHLIGHTS
    1. 1.1 EXECUTIVE SUMMARY
      1. 1.1.1 Market Overview
      2. 1.1.2 Key Findings
      3. 1.1.3 Market Segmentation
      4. 1.1.4 Competitive Landscape
      5. 1.1.5 Challenges and Opportunities
      6. 1.1.6 Future Outlook
  2. 2 SECTION II: SCOPING, METHODOLOGY AND MARKET STRUCTURE
    1. 2.1 MARKET INTRODUCTION
      1. 2.1.1 Definition
      2. 2.1.2 Scope of the study
        1. 2.1.2.1 Research Objective
        2. 2.1.2.2 Assumption
        3. 2.1.2.3 Limitations
    2. 2.2 RESEARCH METHODOLOGY
      1. 2.2.1 Overview
      2. 2.2.2 Data Mining
      3. 2.2.3 Secondary Research
      4. 2.2.4 Primary Research
        1. 2.2.4.1 Primary Interviews and Information Gathering Process
        2. 2.2.4.2 Breakdown of Primary Respondents
      5. 2.2.5 Forecasting Model
      6. 2.2.6 Market Size Estimation
        1. 2.2.6.1 Bottom-Up Approach
        2. 2.2.6.2 Top-Down Approach
      7. 2.2.7 Data Triangulation
      8. 2.2.8 Validation
  3. 3 SECTION III: QUALITATIVE ANALYSIS
    1. 3.1 MARKET DYNAMICS
      1. 3.1.1 Overview
      2. 3.1.2 Drivers
      3. 3.1.3 Restraints
      4. 3.1.4 Opportunities
    2. 3.2 MARKET FACTOR ANALYSIS
      1. 3.2.1 Value chain Analysis
      2. 3.2.2 Porter's Five Forces Analysis
        1. 3.2.2.1 Bargaining Power of Suppliers
        2. 3.2.2.2 Bargaining Power of Buyers
        3. 3.2.2.3 Threat of New Entrants
        4. 3.2.2.4 Threat of Substitutes
        5. 3.2.2.5 Intensity of Rivalry
      3. 3.2.3 COVID-19 Impact Analysis
        1. 3.2.3.1 Market Impact Analysis
        2. 3.2.3.2 Regional Impact
        3. 3.2.3.3 Opportunity and Threat Analysis
  4. 4 SECTION IV: QUANTITATIVE ANALYSIS
    1. 4.1 Pharmaceutical, BY Type (USD Million)
      1. 4.1.1 Polyethylene Glycol
      2. 4.1.2 Propylene Glycol
      3. 4.1.3 Cellulose
      4. 4.1.4 Glycerin
      5. 4.1.5 Others
    2. 4.2 Pharmaceutical, BY Delivery Mode (USD Million)
      1. 4.2.1 Eye Drops
      2. 4.2.2 Ointments
      3. 4.2.3 Sprays
    3. 4.3 Pharmaceutical, BY Application (USD Million)
      1. 4.3.1 Dry Eye Syndrome
      2. 4.3.2 Allergies And Infections
      3. 4.3.3 Others
    4. 4.4 Pharmaceutical, BY Distribution Channel (USD Million)
      1. 4.4.1 Hospital Pharmacies
      2. 4.4.2 Drug Stores
      3. 4.4.3 Retail Pharmacies
      4. 4.4.4 Online Pharmacies
  5. 5 SECTION V: COMPETITIVE ANALYSIS
    1. 5.1 Competitive Landscape
      1. 5.1.1 Overview
      2. 5.1.2 Competitive Analysis
      3. 5.1.3 Market share Analysis
      4. 5.1.4 Major Growth Strategy in the Pharmaceutical
      5. 5.1.5 Competitive Benchmarking
      6. 5.1.6 Leading Players in Terms of Number of Developments in the Pharmaceutical
      7. 5.1.7 Key developments and growth strategies
        1. 5.1.7.1 New Product Launch/Service Deployment
        2. 5.1.7.2 Merger & Acquisitions
        3. 5.1.7.3 Joint Ventures
      8. 5.1.8 Major Players Financial Matrix
        1. 5.1.8.1 Sales and Operating Income
        2. 5.1.8.2 Major Players R&D Expenditure. 2023
    2. 5.2 Company Profiles
      1. 5.2.1 Allergan (US)
        1. 5.2.1.1 Financial Overview
        2. 5.2.1.2 Products Offered
        3. 5.2.1.3 Key Developments
        4. 5.2.1.4 SWOT Analysis
        5. 5.2.1.5 Key Strategies
      2. 5.2.2 Santen Pharmaceutical (JP)
        1. 5.2.2.1 Financial Overview
        2. 5.2.2.2 Products Offered
        3. 5.2.2.3 Key Developments
        4. 5.2.2.4 SWOT Analysis
        5. 5.2.2.5 Key Strategies
      3. 5.2.3 Bausch Health (CA)
        1. 5.2.3.1 Financial Overview
        2. 5.2.3.2 Products Offered
        3. 5.2.3.3 Key Developments
        4. 5.2.3.4 SWOT Analysis
        5. 5.2.3.5 Key Strategies
      4. 5.2.4 Novartis (CH)
        1. 5.2.4.1 Financial Overview
        2. 5.2.4.2 Products Offered
        3. 5.2.4.3 Key Developments
        4. 5.2.4.4 SWOT Analysis
        5. 5.2.4.5 Key Strategies
      5. 5.2.5 Johnson & Johnson (US)
        1. 5.2.5.1 Financial Overview
        2. 5.2.5.2 Products Offered
        3. 5.2.5.3 Key Developments
        4. 5.2.5.4 SWOT Analysis
        5. 5.2.5.5 Key Strategies
      6. 5.2.6 Alcon (CH)
        1. 5.2.6.1 Financial Overview
        2. 5.2.6.2 Products Offered
        3. 5.2.6.3 Key Developments
        4. 5.2.6.4 SWOT Analysis
        5. 5.2.6.5 Key Strategies
      7. 5.2.7 Ocular Therapeutix (US)
        1. 5.2.7.1 Financial Overview
        2. 5.2.7.2 Products Offered
        3. 5.2.7.3 Key Developments
        4. 5.2.7.4 SWOT Analysis
        5. 5.2.7.5 Key Strategies
      8. 5.2.8 Eyevance Pharmaceuticals (US)
        1. 5.2.8.1 Financial Overview
        2. 5.2.8.2 Products Offered
        3. 5.2.8.3 Key Developments
        4. 5.2.8.4 SWOT Analysis
        5. 5.2.8.5 Key Strategies
    3. 5.3 Appendix
      1. 5.3.1 References
      2. 5.3.2 Related Reports
  6. 6 LIST OF FIGURES
    1. 6.1 MARKET SYNOPSIS
    2. 6.2 US MARKET ANALYSIS BY TYPE
    3. 6.3 US MARKET ANALYSIS BY DELIVERY MODE
    4. 6.4 US MARKET ANALYSIS BY APPLICATION
    5. 6.5 US MARKET ANALYSIS BY DISTRIBUTION CHANNEL
    6. 6.6 KEY BUYING CRITERIA OF PHARMACEUTICAL
    7. 6.7 RESEARCH PROCESS OF MRFR
    8. 6.8 DRO ANALYSIS OF PHARMACEUTICAL
    9. 6.9 DRIVERS IMPACT ANALYSIS: PHARMACEUTICAL
    10. 6.10 RESTRAINTS IMPACT ANALYSIS: PHARMACEUTICAL
    11. 6.11 SUPPLY / VALUE CHAIN: PHARMACEUTICAL
    12. 6.12 PHARMACEUTICAL, BY TYPE, 2024 (% SHARE)
    13. 6.13 PHARMACEUTICAL, BY TYPE, 2024 TO 2035 (USD Million)
    14. 6.14 PHARMACEUTICAL, BY DELIVERY MODE, 2024 (% SHARE)
    15. 6.15 PHARMACEUTICAL, BY DELIVERY MODE, 2024 TO 2035 (USD Million)
    16. 6.16 PHARMACEUTICAL, BY APPLICATION, 2024 (% SHARE)
    17. 6.17 PHARMACEUTICAL, BY APPLICATION, 2024 TO 2035 (USD Million)
    18. 6.18 PHARMACEUTICAL, BY DISTRIBUTION CHANNEL, 2024 (% SHARE)
    19. 6.19 PHARMACEUTICAL, BY DISTRIBUTION CHANNEL, 2024 TO 2035 (USD Million)
    20. 6.20 BENCHMARKING OF MAJOR COMPETITORS
  7. 7 LIST OF TABLES
    1. 7.1 LIST OF ASSUMPTIONS
  8. 7.1.1
    1. 7.2 US MARKET SIZE ESTIMATES; FORECAST
      1. 7.2.1 BY TYPE, 2025-2035 (USD Million)
      2. 7.2.2 BY DELIVERY MODE, 2025-2035 (USD Million)
      3. 7.2.3 BY APPLICATION, 2025-2035 (USD Million)
      4. 7.2.4 BY DISTRIBUTION CHANNEL, 2025-2035 (USD Million)
    2. 7.3 PRODUCT LAUNCH/PRODUCT DEVELOPMENT/APPROVAL
  9. 7.3.1
    1. 7.4 ACQUISITION/PARTNERSHIP
  10. 7.4.1

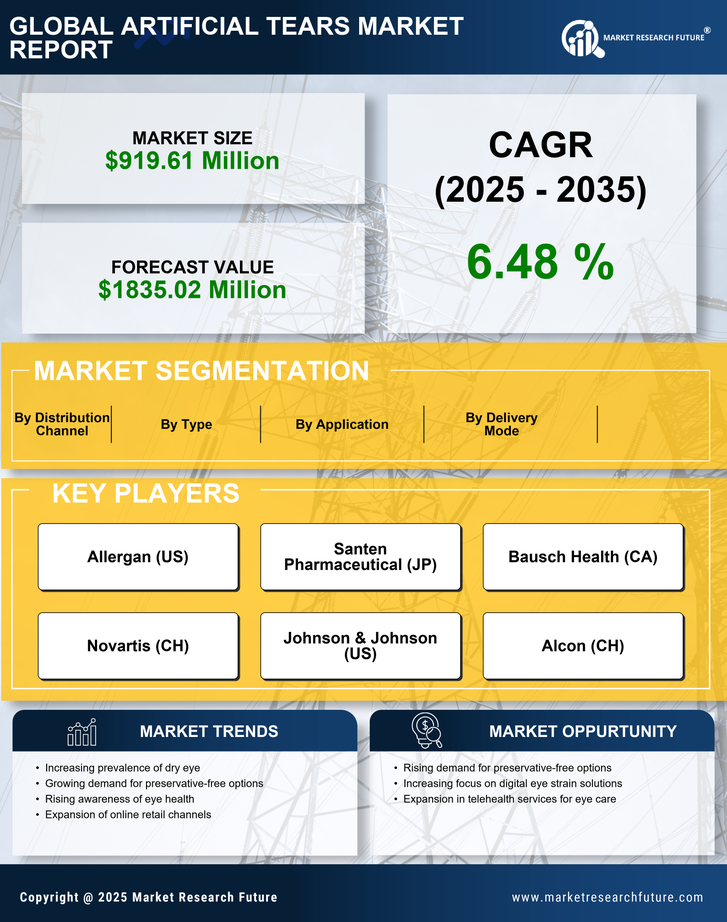
US Pharmaceutical Market Segmentation

Pharmaceutical By Type (USD Million, 2025-2035)

  • Polyethylene Glycol
  • Propylene Glycol
  • Cellulose
  • Glycerin
  • Others

Pharmaceutical By Delivery Mode (USD Million, 2025-2035)

  • Eye Drops
  • Ointments
  • Sprays

Pharmaceutical By Application (USD Million, 2025-2035)

  • Dry Eye Syndrome
  • Allergies And Infections
  • Others

Pharmaceutical By Distribution Channel (USD Million, 2025-2035)

  • Hospital Pharmacies
  • Drug Stores
  • Retail Pharmacies
  • Online Pharmacies