US Aircraft Jack Market

ID: MRFR/AD/18030-HCR
128 Pages
Abbas Raut
Last Updated: April 06, 2026
US Aircraft Jack Market Size, Share, Industry Trend & Analysis Research Report: By Type (Hydraulic Jacks, Mechanical Jacks, Pneumatic Jacks, Electric Jacks), By Application (Civil Aviation, Military Aviation, Cargo Aircraft), By Load Capacity (Below 5 Tons, 5-10 Tons, 10-15 Tons, Above 15 Tons) andBy End Use (MRO Facilities, Aircraft Manufacturing, Airports)- Forecast to 2035
Download PDF ×

We do not share your information with anyone. However, we may send you emails based on your report interest from time to time. You may contact us at any time to opt-out.

US Aircraft Jack Market

Market Size

Forecast Period2025 - 2035
CAGR (2025 - 2035)4.9%
2024 Market Size$ 1,086.92 Million
2025 Market Size$ 1,140.18 Million
2035 Market Size$ 1,840 Million

Key Players

Harrington Hoists Inc
JLG Industries Inc
AeroSpecialties Inc
Boeing
GSE Solutions
TLD Group
Opportunities
  • Growth in Aviation Sector
  • Rising Focus on Cost Efficiency
  • Increasing Demand for Aircraft Maintenance
  1. 1 SECTION I: EXECUTIVE SUMMARY AND KEY HIGHLIGHTS
    1. 1.1 EXECUTIVE SUMMARY
      1. 1.1.1 Market Overview
      2. 1.1.2 Key Findings
      3. 1.1.3 Market Segmentation
      4. 1.1.4 Competitive Landscape
      5. 1.1.5 Challenges and Opportunities
      6. 1.1.6 Future Outlook
  2. 2 SECTION II: SCOPING, METHODOLOGY AND MARKET STRUCTURE
    1. 2.1 MARKET INTRODUCTION
      1. 2.1.1 Definition
      2. 2.1.2 Scope of the study
        1. 2.1.2.1 Research Objective
        2. 2.1.2.2 Assumption
        3. 2.1.2.3 Limitations
    2. 2.2 RESEARCH METHODOLOGY
      1. 2.2.1 Overview
      2. 2.2.2 Data Mining
      3. 2.2.3 Secondary Research
      4. 2.2.4 Primary Research
        1. 2.2.4.1 Primary Interviews and Information Gathering Process
        2. 2.2.4.2 Breakdown of Primary Respondents
      5. 2.2.5 Forecasting Model
      6. 2.2.6 Market Size Estimation
        1. 2.2.6.1 Bottom-Up Approach
        2. 2.2.6.2 Top-Down Approach
      7. 2.2.7 Data Triangulation
      8. 2.2.8 Validation
  3. 3 SECTION III: QUALITATIVE ANALYSIS
    1. 3.1 MARKET DYNAMICS
      1. 3.1.1 Overview
      2. 3.1.2 Drivers
      3. 3.1.3 Restraints
      4. 3.1.4 Opportunities
    2. 3.2 MARKET FACTOR ANALYSIS
      1. 3.2.1 Value chain Analysis
      2. 3.2.2 Porter's Five Forces Analysis
        1. 3.2.2.1 Bargaining Power of Suppliers
        2. 3.2.2.2 Bargaining Power of Buyers
        3. 3.2.2.3 Threat of New Entrants
        4. 3.2.2.4 Threat of Substitutes
        5. 3.2.2.5 Intensity of Rivalry
      3. 3.2.3 COVID-19 Impact Analysis
        1. 3.2.3.1 Market Impact Analysis
        2. 3.2.3.2 Regional Impact
        3. 3.2.3.3 Opportunity and Threat Analysis
  4. 4 SECTION IV: QUANTITATIVE ANALYSIS
    1. 4.1 Food, Beverages & Nutrition, BY Type (USD Million)
      1. 4.1.1 Hydraulic Jacks
      2. 4.1.2 Mechanical Jacks
      3. 4.1.3 Pneumatic Jacks
      4. 4.1.4 Electric Jacks
    2. 4.2 Food, Beverages & Nutrition, BY Application (USD Million)
      1. 4.2.1 Civil Aviation
      2. 4.2.2 Military Aviation
      3. 4.2.3 Cargo Aircraft
    3. 4.3 Food, Beverages & Nutrition, BY Load Capacity (USD Million)
      1. 4.3.1 Below 5 Tons
      2. 4.3.2 5-10 Tons
      3. 4.3.3 10-15 Tons
      4. 4.3.4 Above 15 Tons
    4. 4.4 Food, Beverages & Nutrition, BY End Use (USD Million)
      1. 4.4.1 MRO Facilities
      2. 4.4.2 Aircraft Manufacturing
      3. 4.4.3 Airports
  5. 5 SECTION V: COMPETITIVE ANALYSIS
    1. 5.1 Competitive Landscape
      1. 5.1.1 Overview
      2. 5.1.2 Competitive Analysis
      3. 5.1.3 Market share Analysis
      4. 5.1.4 Major Growth Strategy in the Food, Beverages & Nutrition
      5. 5.1.5 Competitive Benchmarking
      6. 5.1.6 Leading Players in Terms of Number of Developments in the Food, Beverages & Nutrition
      7. 5.1.7 Key developments and growth strategies
        1. 5.1.7.1 New Product Launch/Service Deployment
        2. 5.1.7.2 Merger & Acquisitions
        3. 5.1.7.3 Joint Ventures
      8. 5.1.8 Major Players Financial Matrix
        1. 5.1.8.1 Sales and Operating Income
        2. 5.1.8.2 Major Players R&D Expenditure. 2023
    2. 5.2 Company Profiles
      1. 5.2.1 Harrington Hoists Inc (US)
        1. 5.2.1.1 Financial Overview
        2. 5.2.1.2 Products Offered
        3. 5.2.1.3 Key Developments
        4. 5.2.1.4 SWOT Analysis
        5. 5.2.1.5 Key Strategies
      2. 5.2.2 JLG Industries Inc (US)
        1. 5.2.2.1 Financial Overview
        2. 5.2.2.2 Products Offered
        3. 5.2.2.3 Key Developments
        4. 5.2.2.4 SWOT Analysis
        5. 5.2.2.5 Key Strategies
      3. 5.2.3 AeroSpecialties Inc (US)
        1. 5.2.3.1 Financial Overview
        2. 5.2.3.2 Products Offered
        3. 5.2.3.3 Key Developments
        4. 5.2.3.4 SWOT Analysis
        5. 5.2.3.5 Key Strategies
      4. 5.2.4 Boeing (US)
        1. 5.2.4.1 Financial Overview
        2. 5.2.4.2 Products Offered
        3. 5.2.4.3 Key Developments
        4. 5.2.4.4 SWOT Analysis
        5. 5.2.4.5 Key Strategies
      5. 5.2.5 GSE Solutions (US)
        1. 5.2.5.1 Financial Overview
        2. 5.2.5.2 Products Offered
        3. 5.2.5.3 Key Developments
        4. 5.2.5.4 SWOT Analysis
        5. 5.2.5.5 Key Strategies
      6. 5.2.6 TLD Group (FR)
        1. 5.2.6.1 Financial Overview
        2. 5.2.6.2 Products Offered
        3. 5.2.6.3 Key Developments
        4. 5.2.6.4 SWOT Analysis
        5. 5.2.6.5 Key Strategies
      7. 5.2.7 AeroLift (US)
        1. 5.2.7.1 Financial Overview
        2. 5.2.7.2 Products Offered
        3. 5.2.7.3 Key Developments
        4. 5.2.7.4 SWOT Analysis
        5. 5.2.7.5 Key Strategies
      8. 5.2.8 Miller Electric Mfg Co (US)
        1. 5.2.8.1 Financial Overview
        2. 5.2.8.2 Products Offered
        3. 5.2.8.3 Key Developments
        4. 5.2.8.4 SWOT Analysis
        5. 5.2.8.5 Key Strategies
      9. 5.2.9 Hoffman Manufacturing (US)
        1. 5.2.9.1 Financial Overview
        2. 5.2.9.2 Products Offered
        3. 5.2.9.3 Key Developments
        4. 5.2.9.4 SWOT Analysis
        5. 5.2.9.5 Key Strategies
    3. 5.3 Appendix
      1. 5.3.1 References
      2. 5.3.2 Related Reports
  6. 6 LIST OF FIGURES
    1. 6.1 MARKET SYNOPSIS
    2. 6.2 US MARKET ANALYSIS BY TYPE
    3. 6.3 US MARKET ANALYSIS BY APPLICATION
    4. 6.4 US MARKET ANALYSIS BY LOAD CAPACITY
    5. 6.5 US MARKET ANALYSIS BY END USE
    6. 6.6 KEY BUYING CRITERIA OF FOOD, BEVERAGES & NUTRITION
    7. 6.7 RESEARCH PROCESS OF MRFR
    8. 6.8 DRO ANALYSIS OF FOOD, BEVERAGES & NUTRITION
    9. 6.9 DRIVERS IMPACT ANALYSIS: FOOD, BEVERAGES & NUTRITION
    10. 6.10 RESTRAINTS IMPACT ANALYSIS: FOOD, BEVERAGES & NUTRITION
    11. 6.11 SUPPLY / VALUE CHAIN: FOOD, BEVERAGES & NUTRITION
    12. 6.12 FOOD, BEVERAGES & NUTRITION, BY TYPE, 2024 (% SHARE)
    13. 6.13 FOOD, BEVERAGES & NUTRITION, BY TYPE, 2024 TO 2035 (USD Million)
    14. 6.14 FOOD, BEVERAGES & NUTRITION, BY APPLICATION, 2024 (% SHARE)
    15. 6.15 FOOD, BEVERAGES & NUTRITION, BY APPLICATION, 2024 TO 2035 (USD Million)
    16. 6.16 FOOD, BEVERAGES & NUTRITION, BY LOAD CAPACITY, 2024 (% SHARE)
    17. 6.17 FOOD, BEVERAGES & NUTRITION, BY LOAD CAPACITY, 2024 TO 2035 (USD Million)
    18. 6.18 FOOD, BEVERAGES & NUTRITION, BY END USE, 2024 (% SHARE)
    19. 6.19 FOOD, BEVERAGES & NUTRITION, BY END USE, 2024 TO 2035 (USD Million)
    20. 6.20 BENCHMARKING OF MAJOR COMPETITORS
  7. 7 LIST OF TABLES
    1. 7.1 LIST OF ASSUMPTIONS
  8. 7.1.1
    1. 7.2 US MARKET SIZE ESTIMATES; FORECAST
      1. 7.2.1 BY TYPE, 2025-2035 (USD Million)
      2. 7.2.2 BY APPLICATION, 2025-2035 (USD Million)
      3. 7.2.3 BY LOAD CAPACITY, 2025-2035 (USD Million)
      4. 7.2.4 BY END USE, 2025-2035 (USD Million)
    2. 7.3 PRODUCT LAUNCH/PRODUCT DEVELOPMENT/APPROVAL
  9. 7.3.1
    1. 7.4 ACQUISITION/PARTNERSHIP
  10. 7.4.1

US Food, Beverages & Nutrition Market Segmentation

Food, Beverages & Nutrition By Type (USD Million, 2025-2035)
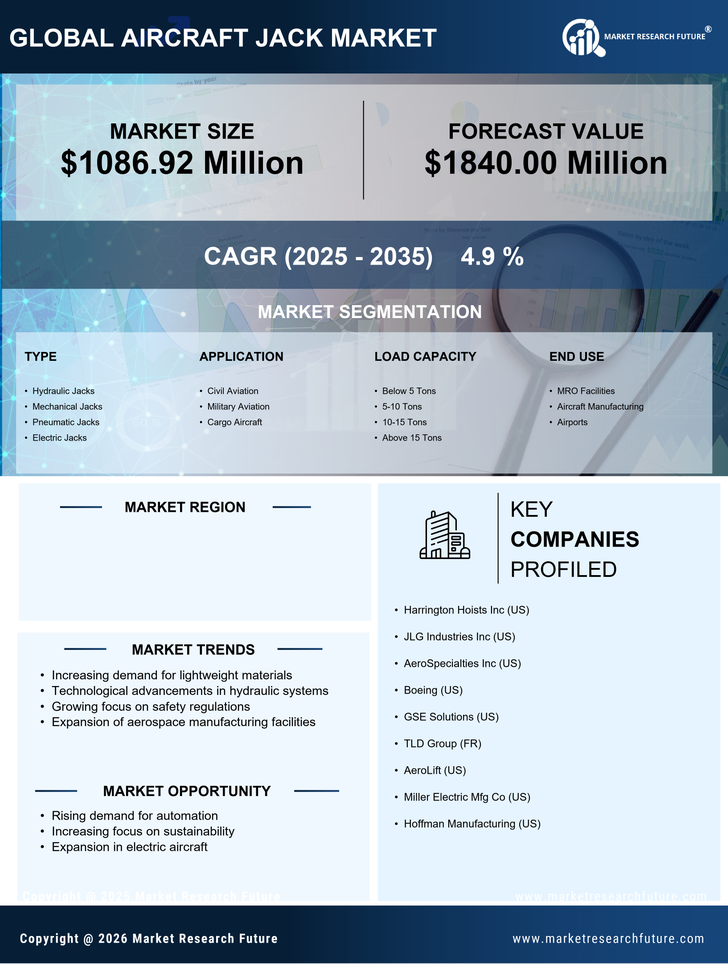
  • Hydraulic Jacks
  • Mechanical Jacks
  • Pneumatic Jacks
  • Electric Jacks

Food, Beverages & Nutrition By Application (USD Million, 2025-2035)

  • Civil Aviation
  • Military Aviation
  • Cargo Aircraft

Food, Beverages & Nutrition By Load Capacity (USD Million, 2025-2035)

  • Below 5 Tons
  • 5-10 Tons
  • 10-15 Tons
  • Above 15 Tons

Food, Beverages & Nutrition By End Use (USD Million, 2025-2035)

  • MRO Facilities
  • Aircraft Manufacturing
  • Airports