US Adenomyosis Market

ID: MRFR/Pharma/18313-HCR
100 Pages
Nidhi Mandole
Last Updated: April 06, 2026
US Adenomyosis Market Research Report By Diagnosis Method (Transvaginal Ultrasound, Magnetic Resonance Imaging, Hysteroscopy, Laparoscopy), By Treatment Type (Medication, Surgery, Hormonal Therapy, Supportive Care), By Care Setting (Hospital, Outpatient Clinic, Home Care) and By Patient Age Group (18-25 years, 26-35 years, 36-45 years, 46-55 years) - Growth & Industry Forecast 2025 To 2035
Download PDF ×

We do not share your information with anyone. However, we may send you emails based on your report interest from time to time. You may contact us at any time to opt-out.

US Adenomyosis Market

Market Size

Forecast Period2025 - 2035
CAGR (2025 - 2035)3.39%
2024 Market Size$ 35.7 Million
2025 Market Size$ 36.91 Million
2035 Market Size$ 51.5 Million

Key Players

AbbVie
Bayer
Hologic
Merck
Pfizer
Teva
Opportunities
  • Rising Healthcare Expenditure
  • Increasing Prevalence of Adenomyosis
  • Technological Innovations in Diagnostics
  1. 1 SECTION I: EXECUTIVE SUMMARY AND KEY HIGHLIGHTS
    1. 1.1 EXECUTIVE SUMMARY
      1. 1.1.1 Market Overview
      2. 1.1.2 Key Findings
      3. 1.1.3 Market Segmentation
      4. 1.1.4 Competitive Landscape
      5. 1.1.5 Challenges and Opportunities
      6. 1.1.6 Future Outlook
  2. 2 SECTION II: SCOPING, METHODOLOGY AND MARKET STRUCTURE
    1. 2.1 MARKET INTRODUCTION
      1. 2.1.1 Definition
      2. 2.1.2 Scope of the study
        1. 2.1.2.1 Research Objective
        2. 2.1.2.2 Assumption
        3. 2.1.2.3 Limitations
    2. 2.2 RESEARCH METHODOLOGY
      1. 2.2.1 Overview
      2. 2.2.2 Data Mining
      3. 2.2.3 Secondary Research
      4. 2.2.4 Primary Research
        1. 2.2.4.1 Primary Interviews and Information Gathering Process
        2. 2.2.4.2 Breakdown of Primary Respondents
      5. 2.2.5 Forecasting Model
      6. 2.2.6 Market Size Estimation
        1. 2.2.6.1 Bottom-Up Approach
        2. 2.2.6.2 Top-Down Approach
      7. 2.2.7 Data Triangulation
      8. 2.2.8 Validation
  3. 3 SECTION III: QUALITATIVE ANALYSIS
    1. 3.1 MARKET DYNAMICS
      1. 3.1.1 Overview
      2. 3.1.2 Drivers
      3. 3.1.3 Restraints
      4. 3.1.4 Opportunities
    2. 3.2 MARKET FACTOR ANALYSIS
      1. 3.2.1 Value chain Analysis
      2. 3.2.2 Porter's Five Forces Analysis
        1. 3.2.2.1 Bargaining Power of Suppliers
        2. 3.2.2.2 Bargaining Power of Buyers
        3. 3.2.2.3 Threat of New Entrants
        4. 3.2.2.4 Threat of Substitutes
        5. 3.2.2.5 Intensity of Rivalry
      3. 3.2.3 COVID-19 Impact Analysis
        1. 3.2.3.1 Market Impact Analysis
        2. 3.2.3.2 Regional Impact
        3. 3.2.3.3 Opportunity and Threat Analysis
  4. 4 SECTION IV: QUANTITATIVE ANALYSIS
    1. 4.1 Life Sciences, BY Type (USD Million)
      1. 4.1.1 Focal
      2. 4.1.2 Adenomyoma
      3. 4.1.3 Diffuse
    2. 4.2 Life Sciences, BY Treatment (USD Million)
      1. 4.2.1 Anti-Inflammatory Drugs
      2. 4.2.2 Hormone Medications
      3. 4.2.3 Hysterectomy
    3. 4.3 Life Sciences, BY Diagnosis (USD Million)
      1. 4.3.1 Ultrasound
      2. 4.3.2 MRI
      3. 4.3.3 Historiography
      4. 4.3.4 Hysteroscopy
      5. 4.3.5 Cystoscopy
      6. 4.3.6 Laparoscopy
    4. 4.4 Life Sciences, BY End-user (USD Million)
      1. 4.4.1 Hospitals & Clinics
      2. 4.4.2 Ambulatory Surgical Centers
      3. 4.4.3 Research Institutes
      4. 4.4.4 Others
  5. 5 SECTION V: COMPETITIVE ANALYSIS
    1. 5.1 Competitive Landscape
      1. 5.1.1 Overview
      2. 5.1.2 Competitive Analysis
      3. 5.1.3 Market share Analysis
      4. 5.1.4 Major Growth Strategy in the Life Sciences
      5. 5.1.5 Competitive Benchmarking
      6. 5.1.6 Leading Players in Terms of Number of Developments in the Life Sciences
      7. 5.1.7 Key developments and growth strategies
        1. 5.1.7.1 New Product Launch/Service Deployment
        2. 5.1.7.2 Merger & Acquisitions
        3. 5.1.7.3 Joint Ventures
      8. 5.1.8 Major Players Financial Matrix
        1. 5.1.8.1 Sales and Operating Income
        2. 5.1.8.2 Major Players R&D Expenditure. 2023
    2. 5.2 Company Profiles
      1. 5.2.1 AbbVie (US)
        1. 5.2.1.1 Financial Overview
        2. 5.2.1.2 Products Offered
        3. 5.2.1.3 Key Developments
        4. 5.2.1.4 SWOT Analysis
        5. 5.2.1.5 Key Strategies
      2. 5.2.2 Bayer (DE)
        1. 5.2.2.1 Financial Overview
        2. 5.2.2.2 Products Offered
        3. 5.2.2.3 Key Developments
        4. 5.2.2.4 SWOT Analysis
        5. 5.2.2.5 Key Strategies
      3. 5.2.3 Hologic (US)
        1. 5.2.3.1 Financial Overview
        2. 5.2.3.2 Products Offered
        3. 5.2.3.3 Key Developments
        4. 5.2.3.4 SWOT Analysis
        5. 5.2.3.5 Key Strategies
      4. 5.2.4 Merck (DE)
        1. 5.2.4.1 Financial Overview
        2. 5.2.4.2 Products Offered
        3. 5.2.4.3 Key Developments
        4. 5.2.4.4 SWOT Analysis
        5. 5.2.4.5 Key Strategies
      5. 5.2.5 Pfizer (US)
        1. 5.2.5.1 Financial Overview
        2. 5.2.5.2 Products Offered
        3. 5.2.5.3 Key Developments
        4. 5.2.5.4 SWOT Analysis
        5. 5.2.5.5 Key Strategies
      6. 5.2.6 Teva (IL)
        1. 5.2.6.1 Financial Overview
        2. 5.2.6.2 Products Offered
        3. 5.2.6.3 Key Developments
        4. 5.2.6.4 SWOT Analysis
        5. 5.2.6.5 Key Strategies
      7. 5.2.7 Amgen (US)
        1. 5.2.7.1 Financial Overview
        2. 5.2.7.2 Products Offered
        3. 5.2.7.3 Key Developments
        4. 5.2.7.4 SWOT Analysis
        5. 5.2.7.5 Key Strategies
      8. 5.2.8 Ferring Pharmaceuticals (CH)
        1. 5.2.8.1 Financial Overview
        2. 5.2.8.2 Products Offered
        3. 5.2.8.3 Key Developments
        4. 5.2.8.4 SWOT Analysis
        5. 5.2.8.5 Key Strategies
    3. 5.3 Appendix
      1. 5.3.1 References
      2. 5.3.2 Related Reports
  6. 6 LIST OF FIGURES
    1. 6.1 MARKET SYNOPSIS
    2. 6.2 US MARKET ANALYSIS BY TYPE
    3. 6.3 US MARKET ANALYSIS BY TREATMENT
    4. 6.4 US MARKET ANALYSIS BY DIAGNOSIS
    5. 6.5 US MARKET ANALYSIS BY END-USER
    6. 6.6 KEY BUYING CRITERIA OF LIFE SCIENCES
    7. 6.7 RESEARCH PROCESS OF MRFR
    8. 6.8 DRO ANALYSIS OF LIFE SCIENCES
    9. 6.9 DRIVERS IMPACT ANALYSIS: LIFE SCIENCES
    10. 6.10 RESTRAINTS IMPACT ANALYSIS: LIFE SCIENCES
    11. 6.11 SUPPLY / VALUE CHAIN: LIFE SCIENCES
    12. 6.12 LIFE SCIENCES, BY TYPE, 2024 (% SHARE)
    13. 6.13 LIFE SCIENCES, BY TYPE, 2024 TO 2035 (USD Million)
    14. 6.14 LIFE SCIENCES, BY TREATMENT, 2024 (% SHARE)
    15. 6.15 LIFE SCIENCES, BY TREATMENT, 2024 TO 2035 (USD Million)
    16. 6.16 LIFE SCIENCES, BY DIAGNOSIS, 2024 (% SHARE)
    17. 6.17 LIFE SCIENCES, BY DIAGNOSIS, 2024 TO 2035 (USD Million)
    18. 6.18 LIFE SCIENCES, BY END-USER, 2024 (% SHARE)
    19. 6.19 LIFE SCIENCES, BY END-USER, 2024 TO 2035 (USD Million)
    20. 6.20 BENCHMARKING OF MAJOR COMPETITORS
  7. 7 LIST OF TABLES
    1. 7.1 LIST OF ASSUMPTIONS
  8. 7.1.1
    1. 7.2 US MARKET SIZE ESTIMATES; FORECAST
      1. 7.2.1 BY TYPE, 2025-2035 (USD Million)
      2. 7.2.2 BY TREATMENT, 2025-2035 (USD Million)
      3. 7.2.3 BY DIAGNOSIS, 2025-2035 (USD Million)
      4. 7.2.4 BY END-USER, 2025-2035 (USD Million)
    2. 7.3 PRODUCT LAUNCH/PRODUCT DEVELOPMENT/APPROVAL
  9. 7.3.1
    1. 7.4 ACQUISITION/PARTNERSHIP
  10. 7.4.1

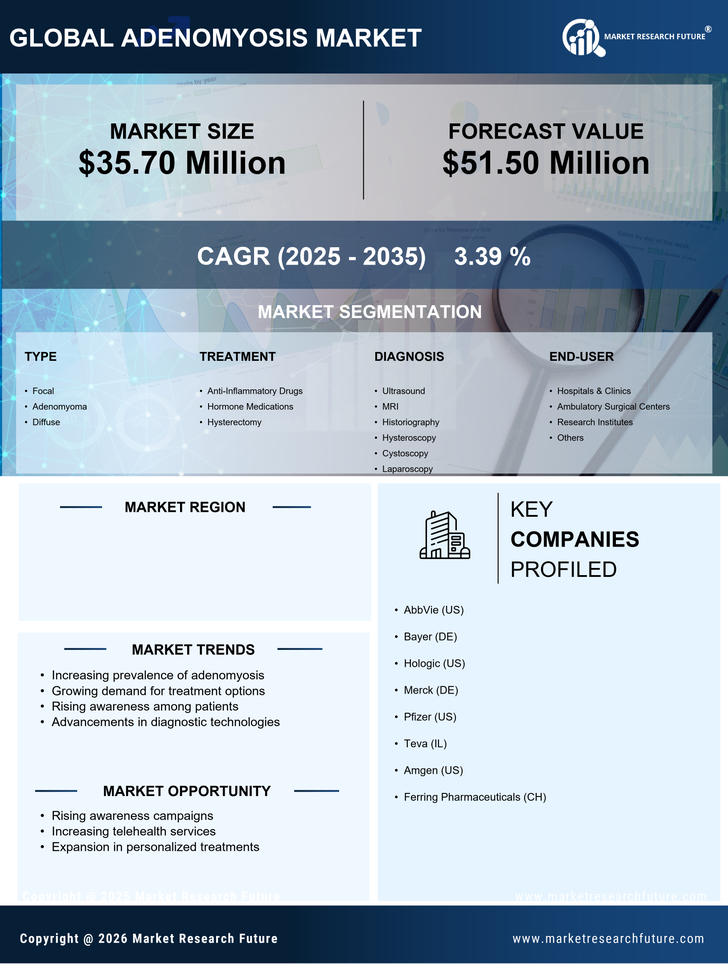
US Life Sciences Market Segmentation

Life Sciences By Type (USD Million, 2025-2035)

  • Focal
  • Adenomyoma
  • Diffuse

Life Sciences By Treatment (USD Million, 2025-2035)

  • Anti-Inflammatory Drugs
  • Hormone Medications
  • Hysterectomy

Life Sciences By Diagnosis (USD Million, 2025-2035)

  • Ultrasound
  • MRI
  • Historiography
  • Hysteroscopy
  • Cystoscopy
  • Laparoscopy

Life Sciences By End-user (USD Million, 2025-2035)

  • Hospitals & Clinics
  • Ambulatory Surgical Centers
  • Research Institutes
  • Others