ID: MRFR/Pharma/4983-HCR | February 2021 | Region: Global | 100 pages
Market Scenario
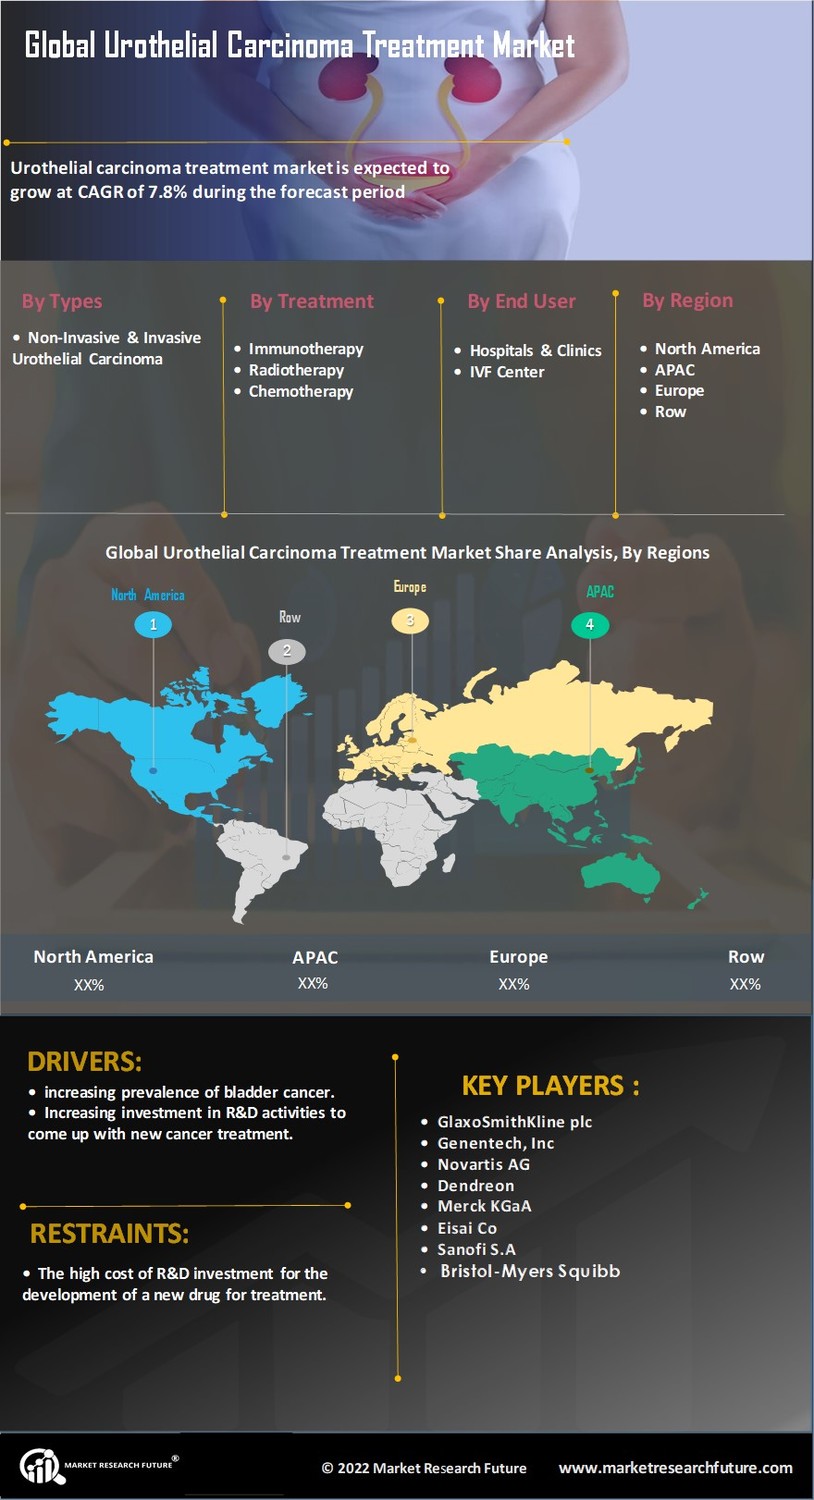
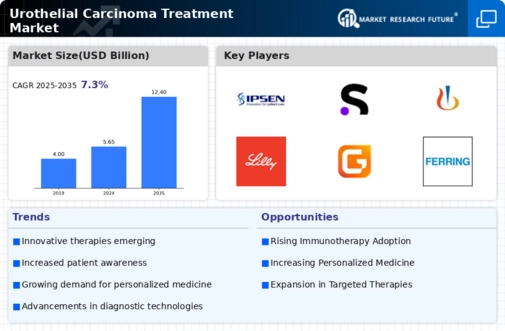
Global urothelial carcinoma treatment market is expected to grow over the forecast period of 2023 and is expected to register a CAGR ~7.8% during the forecast period of 2018–2023.
Urothelial carcinoma is also called as transitional cell carcinoma which is a cancerous tumor of the bladder that can spread to other parts of the body. These are also called as malignant tumors. This tumor can start at any part of the urinary tract. People with bladder cancer may also have similar cancer in other parts of the urinary tract. Hence the urothelial carcinoma treatment market is expected to grow due to increasing prevalence of bladder cancer. Increasing investment in R&D activities to come up with new cancer treatment is also boosting the market for urothelial carcinoma treatment. As various awareness programs are carried out by government and non-government organizations regarding bladder cancer, it is expected to boost the urothelial carcinoma treatment market during the forecast period.
Various factors that can hamper the growth of the market are the presence of the generic drug in the market and the high cost of R&D investment for the development of a new drug for treatment.
Segmentation
The global urothelial carcinoma treatment market has been segmented on the basis of types, treatment, and end-users. Based on type the global urothelial carcinoma treatment is segmented into non-invasive and invasive urothelial carcinoma treatment. On basis of treatment, the market is segmented into immunotherapy, radiotherapy, and chemotherapy. Based on end-user the urothelial carcinoma market is segmented into hospital pharmacy, retail pharmacy, and others.
Key players
Key players for the global urothelial carcinoma treatment market are GlaxoSmithKline plc, Genentech, Inc., Novartis AG, Dendreon, Merck KGaA, Eisai Co., Sanofi S.A., Bristol-Myers Squibb.
Regional Market Summary
Global Urothelial Carcinoma Treatment Market Share (%), by Region, 2017
Source: Centers for Disease Control and Prevention (CDC)
On a regional basis, the market is segmented into the Americas, Europe, Asia-Pacific, and the Middle East and Africa.
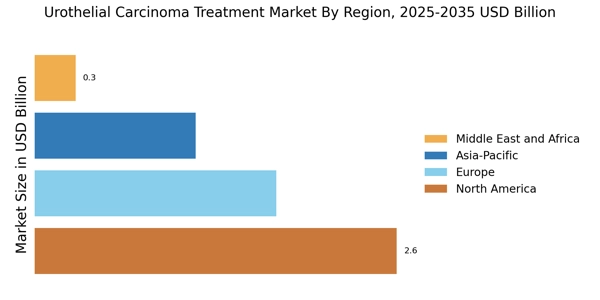
Americas is likely to dominate the urothelial carcinoma treatment market owing to the increasing prevalence of bladder cancer, increasing investment in research and development of new bladder cancer treatment. According to the American cancer society report, about 79030 cases of bladder cancer was reported in 2017 in the US.
Europe is the second largest market for the urothelial carcinoma treatment followed by Asia-Pacific. Due to growing awareness regarding early diagnosis of bladder cancer and developed healthcare infrastructure with increasing prevalence of urothelial cancer. Asia-Pacific shows the fastest growth in the market due to the low cost of R&D. India and China are expected to be the fastest growing market for bladder cancer treatment.
The Middle East and Africa has the lowest market for urothelial carcinoma treatment due to poor medical facilities and lack of technology.
Global Urothelial Carcinoma Treatment Market, by Type
Global Urothelial Carcinoma Treatment Market, by Treatment
Global Urothelial Carcinoma Treatment Market, by End-User
Global Urothelial Carcinoma Treatment Market, by Region
Intended Audience
Frequently Asked Questions (FAQ) :
Urothelial Carcinoma, also known as transitional cell carcinoma, is a cancer of the urinary bladder that can spread to other parts of the body.
Urothelial Carcinoma is expected to exhibit a strong 7.8% CAGR over the forecast period from 2020 to 2027.
Growing prevalence of cancer is the major driver for the market.
Americas hold the largest share in the global Urothelial Carcinoma Market.
Leading players in the Urothelial Carcinoma Market include Sanofi, Genentech, and Novartis, among others.
Table of Contents:
Chapter 1. Report Prologue
Chapter 2. Market Introduction
2.1 Definition
2.2 Scope of the Study
2.2.1 Research Objective
2.2.2 Assumptions
2.2.3 Limitations
Chapter 3. Research Methodology
3.1 Introduction
3.2 Primary Research
3.3 Secondary Research
3.4 Market Size Estimation
Chapter 4. Market Dynamics
4.1 Drivers
4.2 Restraints
4.3 Opportunities
4.4 Challenges
4.5 Macroeconomic Indicators
4.6 Technology Trends & Assessment
Chapter 5. Market Factor Analysis
5.1 Porter’s Five Forces Analysis
5.1.1 Bargaining Power of Suppliers
5.1.2 Bargaining Power of Buyers
5.1.3 Threat of New Entrants
5.1.4 Threat of Substitutes
5.1.5 Intensity of Rivalry
5.2 Value Chain Analysis
5.3 Investment Feasibility Analysis
5.4 Pricing Analysis
Chapter 6. Global Urothelial Carcinoma Treatment Market, by Types
6.1 Introduction
6.2 Non-invasive Urothelial Carcinoma
Market Estimates & Forecast, by Region, 2020–2027
Market Estimates & Forecast, by Country, 2020–2027
6.3 Invasive Urothelial Carcinoma
Market Estimates & Forecast, by Region, 2020–2027
Market Estimates & Forecast, by Country, 2020–2027
Chapter 7. Global Urothelial Carcinoma Treatment Market, by Treatment
7.1 Introduction
7.2 Immunotherapy
Market Estimates & Forecast, by Region, 2020–2027
Market Estimates & Forecast, by Country, 2020–2027
7.3 Radiotherapy
Market Estimates & Forecast, by Region, 2020–2027
Market Estimates & Forecast, by Country, 2020–2027
7.4 Chemotherapy
Market Estimates & Forecast, by Region, 2020–2027
Market Estimates & Forecast, by Country, 2020–2027
Chapter 8. Global Urothelial Carcinoma Treatment Market, by End-User
8.1 Introduction
8.2 Hospital Pharmacy
Market Estimates & Forecast, by Region, 2020–2027
Market Estimates & Forecast, by Country, 2020–2027
8.3 Retail Pharmacy
Market Estimates & Forecast, by Region, 2020–2027
Market Estimates & Forecast, by Country, 2020–2027
8.4 Others
Market Estimates & Forecast, by Region, 2020–2027
Market Estimates & Forecast, by Country, 2020–2027
Chapter 9. Global Urothelial Carcinoma Treatment Market, by Region
9.1 Introduction
9.2 Americas
9.2.1 North America
9.2.1.1 US
9.2.1.2 Canada
9.2.2 South America
9.3 Europe
9.3.1 Western Europe
9.3.1.1 Germany
9.3.1.2 France
9.3.1.3 Italy
9.3.1.4 Spain
9.3.1.5 UK
9.3.1.6 Rest of Western Europe
9.3.2 Eastern Europe
9.4 Asia-Pacific
9.4.1 Japan
9.4.2 China
9.4.3 India
9.4.4 Australia
9.4.5 South Korea
9.4.6 Rest of Asia-Pacific
9.5 Middle East & Africa
9.5.1 Middle East
9.5.2 Africa
Chapter 10. Company Landscape
10.1 Introduction
10.2 Market Share Analysis
10.3 Key Development & Strategies
Chapter 11. Company Profiles
11.1 GlaxoSmithKline plc
11.1.1 Company Overview
11.1.2 Product Overview
11.1.3 Financials Overview
11.1.4 Key Developments
11.1.5 SWOT Analysis
11.2 Genentech, Inc
11.2.1 Company Overview
11.2.2 Product Overview
11.2.3 Financial Overview
11.2.4 Key Developments
11.2.5 SWOT Analysis
11.3 Novartis AG
11.3.1 Company Overview
11.3.2 Product Overview
11.3.3 Financial Overview
11.3.4 Key Development
11.3.5 SWOT Analysis
11.4 Dendreon
11.4.1 Company Overview
11.4.2 Product Overview
11.4.3 Financial Overview
11.4.4 Key Development
11.4.5 SWOT Analysis
11.5 Merck KGaA
11.5.1 Company Overview
11.5.2 Product Overview
11.5.3 Financial overview
11.5.4 Key Developments
11.5.5 SWOT Analysis
11.6 Eisai Co
11.6.1 Company Overview
11.6.2 Product Overview
11.6.3 Financial Overview
11.6.4 Key Developments
11.6.5 SWOT Analysis
11.7 Sanofi S.A
11.7.1 Overview
11.7.2 Product Overview
11.7.3 Financial Overview
11.7.4 Key Developments
11.7.5 SWOT Analysis
11.8 Bristol-Myers Squibb
11.8.1 Overview
11.8.2 Product Overview
11.8.3 Financials
11.8.4 Key Developments
11.8.5 SWOT Analysis
Chapter 12 MRFR Conclusion
12.1 Key Findings
12.1.1 From CEO’s Viewpoint
12.1.2 Unmet Needs of the Market
12.2 Key Companies to Watch
12.3 Predictions for the Urothelial Carcinoma Treatment Industry
Chapter 13. Appendix
LIST OF TABLES
Table 1 Global Urothelial Carcinoma Treatment Market Synopsis, 2020–2027
Table 2 Global Urothelial Carcinoma Treatment Market Estimates and Forecast, 2020–2027
(USD Million)
Table 3 Global Urothelial Carcinoma Treatment Market, by Region, 2020–2027 (USD Million)
Table 4 Global Urothelial Carcinoma Treatment Market, by Types, 2020–2027 (USD Million)
Table 5 Global Urothelial Carcinoma Treatment Market, by Treatment, 2020–2027(USD Million)
Table 6 Global Urothelial Carcinoma Treatment Market, by End-User, 2020–2027 (USD Million)
Table 7 North America: Global Urothelial Carcinoma Treatment Market, by Types, 2020–2027 (USD
Million)
Table 8 North America: Global Urothelial Carcinoma Treatment Market, by Treatment, 2020–2027 (USD Million)
Table 9 North America: Urothelial Carcinoma Treatment Market, by End-User, 2020–2027 (USD Million)
Table 10 US: Urothelial Carcinoma Treatment Market, by Types, 2020–2027 (USD Million)
Table 11 US: Urothelial Carcinoma Treatment Market, by Treatment, 2020–2027 (USD Million)
Table 12 US: Urothelial Carcinoma Treatment Market, by End-User, 2020–2027 (USD Million)
Table 13 Canada: Urothelial Carcinoma Treatment Market, by Types, 2020–2027 (USD Million)
Table 14 Canada: Urothelial Carcinoma Treatment Market, by Treatment, 2020–2027 (USD Million)
Table 15 Canada: Urothelial Carcinoma Treatment Market, by End-User, 2020–2027 (USD Million)
Table 16 South America: Urothelial Carcinoma Treatment Market, by Types, 2020–2027 (USD
Million)
Table 17 South America: Urothelial Carcinoma Treatment Market, by Treatment, 2020–2027 (USD Million)
Table 18 South America: Urothelial Carcinoma Treatment Market, by End-User, 2020–2027 (USD Million)
Table 19 Europe: Urothelial Carcinoma Treatment Market, by Types, 2020–2027 (USD Million)
Table 20 Europe: Urothelial Carcinoma Treatment Market, by Treatment, 2020–2027 (USD Million)
Table 21 Europe: Urothelial Carcinoma Treatment Market, by End-User, 2020–2027 (USD Million)
Table 22 Western Europe: Urothelial Carcinoma Treatment Market, by Types, 2020–2027 (USD
Million)
Table 23 Western Europe: Urothelial Carcinoma Treatment Market, by Treatment, 2020–2027 (USD Million)
Table 24 Western Europe: Urothelial Carcinoma Treatment Market, by End-User, 2020–2027 (USD Million)
Table 25 Eastern Europe: Urothelial Carcinoma Treatment Market, by Types, 2020–2027 (USD
Million)
Table 26 Eastern Europe: Urothelial Carcinoma Treatment Market, by Treatment, 2020–2027 (USD Million)
Table 27 Eastern Europe: Urothelial Carcinoma Treatment Market, by End-User, 2020–2027(USD Million)
Table 28 Asia-Pacific: Urothelial Carcinoma Treatment Market, by Types, 2020–2027 (USD
Million)
Table 29 Asia-Pacific: Urothelial Carcinoma Treatment Market, by Treatment, 2020–2027 (USD Million)
Table 30 Asia-Pacific: Urothelial Carcinoma Treatment Market, by End-User, 2020–2027 (USD Million)
Table 31 Middle East & Africa: Urothelial Carcinoma Treatment Market, by Types, 2020–2027
(USD Million)
Table 32 Middle East & Africa: Urothelial Carcinoma Treatment Market, by Treatment, 2020–2027 (USD Million)
Table 33 Middle East & Africa: Urothelial Carcinoma Treatment Market, by End-User, 2020–2027 (USD Million)
LIST OF FIGURES
Figure 1 Research Process
Figure 2 Segmentation for Global Urothelial Carcinoma Treatment Market
Figure 3 Segmentation Market Dynamics for Global Urothelial Carcinoma Treatment Market
Figure 4 Global Urothelial Carcinoma Treatment Market Share, By Types, 2020
Figure 5 Global Urothelial Carcinoma Treatment Market Share, By Treatment, 2020
Figure 6 Global Urothelial Carcinoma Treatment Market Share, By End-User, 2020
Figure 7 Global Urothelial Carcinoma Treatment Market Share, By Region, 2020
Figure 8 North America: Global Urothelial Carcinoma Treatment Share, By Country, 2020
Figure 9 Europe: Global Urothelial Carcinoma Treatment Share, By Country, 2020
Figure 10 Asia-Pacific: Global Urothelial Carcinoma Treatment Share, By Country, 2020
Figure 11 Middle East & Africa: Global Urothelial Carcinoma Treatment Share, By Country, 2020
Figure 12 Global Urothelial Carcinoma Treatment Share: Company Share Analysis, 2020 (%)
Figure 13 GlaxoSmithKline plc.: Key Financials
Figure 14 GlaxoSmithKline plc.: Segmental Revenue
Figure 15 GlaxoSmithKline plc.: Geographical Revenue
Figure 16 Genentech: Key Financials
Figure 17 Genentech: Segmental Revenue
Figure 18 Genentech: Geographical Revenue
Figure 19 Novartis AG: Key Financials
Figure 20 Novartis AG: Segmental Revenue
Figure 21 Novartis AG: Geographical Revenue
Figure 22 Dendreon: Key Financials
Figure 23 Dendreon: Segmental Revenue
Figure 24 Dendreon: Geographical Revenue
Figure 25 Merck KGaA: Key Financials
Figure 26 Merck KGaA: Segmental Revenue
Figure 27 Merck KGaA: Geographical Revenue
Figure 28 Eisai Co: Key Financials
Figure 29 Eisai Co: Segmental Revenue
Figure 30 Eisai Co: Geographical Revenue
Figure 31 Sanofi S.A: Key Financials
Figure 32 Sanofi S.A: Segmental Revenue
Figure 33 Sanofi S.A: Geographical Revenue
Figure 34 Bristol-Myers Squibb: Key Financials
Figure 35 Bristol-Myers Squibb: Segmental Revenue
Figure 36 Bristol-Myers Squibb: Geographical Revenue