Request Free Sample ×

Kindly complete the form below to receive a free sample of this Report

* Please use a valid business email

Leading companies partner with us for data-driven Insights

clients tt-cursor
Hero Background

UK Iot Digital Transformation Market

ID: MRFR/ICT/59022-HCR
200 Pages
Kiran Jinkalwad
Last Updated: February 06, 2026

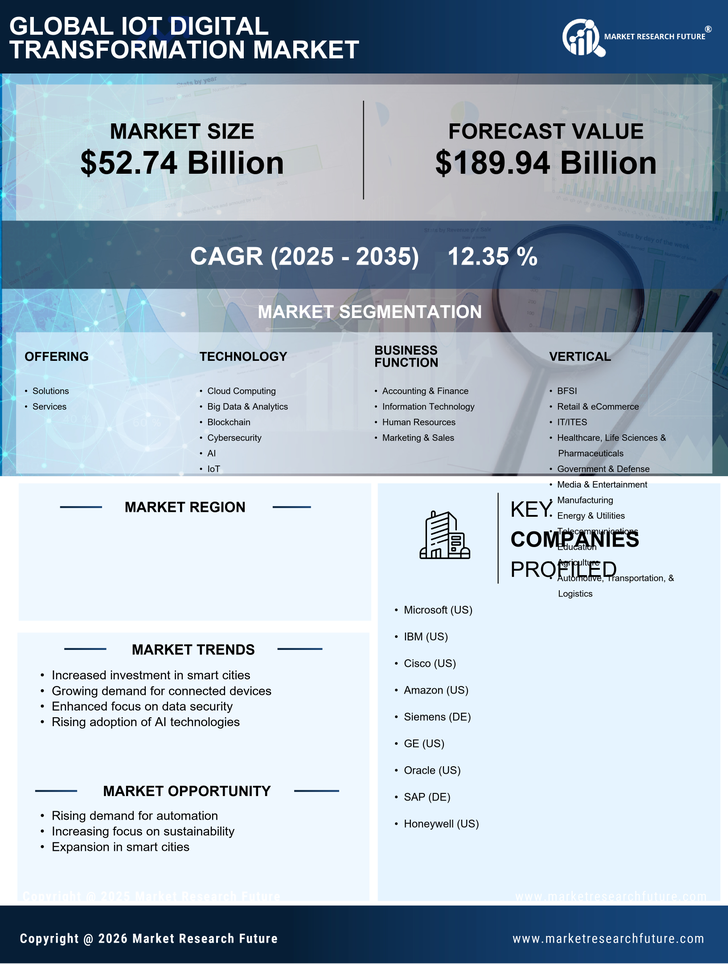
UK IoT Digital Transformation Market Size, Share and Trends Analysis Report By Offering (Solutions, Services), By Technology (Cloud Computing, Big Data & Analytics, Blockchain, Cybersecurity, AI, IoT), By Business Function (Accounting & Finance, Information Technology, Human Resources, Marketing & Sales), and By Vertical (BFSI, Retail & eCommerce, IT/ITES, Healthcare, Life Sciences & Pharmaceuticals, Government & Defense, Media & Entertainment, Manufacturing, Energy & Utilities, Telecommunications, Education, Agriculture, Automotive, Transportation & Logistics)- Forecast to 2035

Share:
Download PDF ×

We do not share your information with anyone. However, we may send you emails based on your report interest from time to time. You may contact us at any time to opt-out.

UK Iot Digital Transformation Market Infographic
Purchase Options
  1. 1 SECTION I: EXECUTIVE SUMMARY AND KEY HIGHLIGHTS
  2.   1.1 EXECUTIVE SUMMARY
  3.     1.1.1 Market Overview
  4.     1.1.2 Key Findings
  5.     1.1.3 Market Segmentation
  6.     1.1.4 Competitive Landscape
  7.     1.1.5 Challenges and Opportunities
  8.     1.1.6 Future Outlook
  9. 2 SECTION II: SCOPING, METHODOLOGY AND MARKET STRUCTURE
  10.   2.1 MARKET INTRODUCTION
  11.     2.1.1 Definition
  12.     2.1.2 Scope of the study
  13.       2.1.2.1 Research Objective
  14.       2.1.2.2 Assumption
  15.       2.1.2.3 Limitations
  16.   2.2 RESEARCH METHODOLOGY
  17.     2.2.1 Overview
  18.     2.2.2 Data Mining
  19.     2.2.3 Secondary Research
  20.     2.2.4 Primary Research
  21.       2.2.4.1 Primary Interviews and Information Gathering Process
  22.       2.2.4.2 Breakdown of Primary Respondents
  23.     2.2.5 Forecasting Model
  24.     2.2.6 Market Size Estimation
  25.       2.2.6.1 Bottom-Up Approach
  26.       2.2.6.2 Top-Down Approach
  27.     2.2.7 Data Triangulation
  28.     2.2.8 Validation
  29. 3 SECTION III: QUALITATIVE ANALYSIS
  30.   3.1 MARKET DYNAMICS
  31.     3.1.1 Overview
  32.     3.1.2 Drivers
  33.     3.1.3 Restraints
  34.     3.1.4 Opportunities
  35.   3.2 MARKET FACTOR ANALYSIS
  36.     3.2.1 Value chain Analysis
  37.     3.2.2 Porter's Five Forces Analysis
  38.       3.2.2.1 Bargaining Power of Suppliers
  39.       3.2.2.2 Bargaining Power of Buyers
  40.       3.2.2.3 Threat of New Entrants
  41.       3.2.2.4 Threat of Substitutes
  42.       3.2.2.5 Intensity of Rivalry
  43.     3.2.3 COVID-19 Impact Analysis
  44.       3.2.3.1 Market Impact Analysis
  45.       3.2.3.2 Regional Impact
  46.       3.2.3.3 Opportunity and Threat Analysis
  47. 4 SECTION IV: QUANTITATIVE ANALYSIS
  48.   4.1 Information and Communications Technology, BY Offering (USD Billion)
  49.     4.1.1 Solutions
  50.     4.1.2 Services
  51.   4.2 Information and Communications Technology, BY Technology (USD Billion)
  52.     4.2.1 Cloud Computing
  53.     4.2.2 Big Data & Analytics
  54.     4.2.3 Blockchain
  55.     4.2.4 Cybersecurity
  56.     4.2.5 AI
  57.     4.2.6 IoT
  58.   4.3 Information and Communications Technology, BY Business Function (USD Billion)
  59.     4.3.1 Accounting & Finance
  60.     4.3.2 Information Technology
  61.     4.3.3 Human Resources
  62.     4.3.4 Marketing & Sales
  63.   4.4 Information and Communications Technology, BY Vertical (USD Billion)
  64.     4.4.1 BFSI
  65.     4.4.2 Retail & eCommerce
  66.     4.4.3 IT/ITES
  67.     4.4.4 Healthcare, Life Sciences & Pharmaceuticals
  68.     4.4.5 Government & Defense
  69.     4.4.6 Media & Entertainment
  70.     4.4.7 Manufacturing
  71.     4.4.8 Energy & Utilities
  72.     4.4.9 Telecommunications
  73.     4.4.10 Education
  74.     4.4.11 Agriculture
  75.     4.4.12 Automotive, Transportation, & Logistics
  76. 5 SECTION V: COMPETITIVE ANALYSIS
  77.   5.1 Competitive Landscape
  78.     5.1.1 Overview
  79.     5.1.2 Competitive Analysis
  80.     5.1.3 Market share Analysis
  81.     5.1.4 Major Growth Strategy in the Information and Communications Technology
  82.     5.1.5 Competitive Benchmarking
  83.     5.1.6 Leading Players in Terms of Number of Developments in the Information and Communications Technology
  84.     5.1.7 Key developments and growth strategies
  85.       5.1.7.1 New Product Launch/Service Deployment
  86.       5.1.7.2 Merger & Acquisitions
  87.       5.1.7.3 Joint Ventures
  88.     5.1.8 Major Players Financial Matrix
  89.       5.1.8.1 Sales and Operating Income
  90.       5.1.8.2 Major Players R&D Expenditure. 2023
  91.   5.2 Company Profiles
  92.     5.2.1 Microsoft (US)
  93.       5.2.1.1 Financial Overview
  94.       5.2.1.2 Products Offered
  95.       5.2.1.3 Key Developments
  96.       5.2.1.4 SWOT Analysis
  97.       5.2.1.5 Key Strategies
  98.     5.2.2 IBM (US)
  99.       5.2.2.1 Financial Overview
  100.       5.2.2.2 Products Offered
  101.       5.2.2.3 Key Developments
  102.       5.2.2.4 SWOT Analysis
  103.       5.2.2.5 Key Strategies
  104.     5.2.3 Cisco (US)
  105.       5.2.3.1 Financial Overview
  106.       5.2.3.2 Products Offered
  107.       5.2.3.3 Key Developments
  108.       5.2.3.4 SWOT Analysis
  109.       5.2.3.5 Key Strategies
  110.     5.2.4 Amazon (US)
  111.       5.2.4.1 Financial Overview
  112.       5.2.4.2 Products Offered
  113.       5.2.4.3 Key Developments
  114.       5.2.4.4 SWOT Analysis
  115.       5.2.4.5 Key Strategies
  116.     5.2.5 Siemens (DE)
  117.       5.2.5.1 Financial Overview
  118.       5.2.5.2 Products Offered
  119.       5.2.5.3 Key Developments
  120.       5.2.5.4 SWOT Analysis
  121.       5.2.5.5 Key Strategies
  122.     5.2.6 GE (US)
  123.       5.2.6.1 Financial Overview
  124.       5.2.6.2 Products Offered
  125.       5.2.6.3 Key Developments
  126.       5.2.6.4 SWOT Analysis
  127.       5.2.6.5 Key Strategies
  128.     5.2.7 Oracle (US)
  129.       5.2.7.1 Financial Overview
  130.       5.2.7.2 Products Offered
  131.       5.2.7.3 Key Developments
  132.       5.2.7.4 SWOT Analysis
  133.       5.2.7.5 Key Strategies
  134.     5.2.8 SAP (DE)
  135.       5.2.8.1 Financial Overview
  136.       5.2.8.2 Products Offered
  137.       5.2.8.3 Key Developments
  138.       5.2.8.4 SWOT Analysis
  139.       5.2.8.5 Key Strategies
  140.     5.2.9 Honeywell (US)
  141.       5.2.9.1 Financial Overview
  142.       5.2.9.2 Products Offered
  143.       5.2.9.3 Key Developments
  144.       5.2.9.4 SWOT Analysis
  145.       5.2.9.5 Key Strategies
  146.   5.3 Appendix
  147.     5.3.1 References
  148.     5.3.2 Related Reports
  149. 6 LIST OF FIGURES
  150.   6.1 MARKET SYNOPSIS
  151.   6.2 UK MARKET ANALYSIS BY OFFERING
  152.   6.3 UK MARKET ANALYSIS BY TECHNOLOGY
  153.   6.4 UK MARKET ANALYSIS BY BUSINESS FUNCTION
  154.   6.5 UK MARKET ANALYSIS BY VERTICAL
  155.   6.6 KEY BUYING CRITERIA OF INFORMATION AND COMMUNICATIONS TECHNOLOGY
  156.   6.7 RESEARCH PROCESS OF MRFR
  157.   6.8 DRO ANALYSIS OF INFORMATION AND COMMUNICATIONS TECHNOLOGY
  158.   6.9 DRIVERS IMPACT ANALYSIS: INFORMATION AND COMMUNICATIONS TECHNOLOGY
  159.   6.10 RESTRAINTS IMPACT ANALYSIS: INFORMATION AND COMMUNICATIONS TECHNOLOGY
  160.   6.11 SUPPLY / VALUE CHAIN: INFORMATION AND COMMUNICATIONS TECHNOLOGY
  161.   6.12 INFORMATION AND COMMUNICATIONS TECHNOLOGY, BY OFFERING, 2024 (% SHARE)
  162.   6.13 INFORMATION AND COMMUNICATIONS TECHNOLOGY, BY OFFERING, 2024 TO 2035 (USD Billion)
  163.   6.14 INFORMATION AND COMMUNICATIONS TECHNOLOGY, BY TECHNOLOGY, 2024 (% SHARE)
  164.   6.15 INFORMATION AND COMMUNICATIONS TECHNOLOGY, BY TECHNOLOGY, 2024 TO 2035 (USD Billion)
  165.   6.16 INFORMATION AND COMMUNICATIONS TECHNOLOGY, BY BUSINESS FUNCTION, 2024 (% SHARE)
  166.   6.17 INFORMATION AND COMMUNICATIONS TECHNOLOGY, BY BUSINESS FUNCTION, 2024 TO 2035 (USD Billion)
  167.   6.18 INFORMATION AND COMMUNICATIONS TECHNOLOGY, BY VERTICAL, 2024 (% SHARE)
  168.   6.19 INFORMATION AND COMMUNICATIONS TECHNOLOGY, BY VERTICAL, 2024 TO 2035 (USD Billion)
  169.   6.20 BENCHMARKING OF MAJOR COMPETITORS
  170. 7 LIST OF TABLES
  171.   7.1 LIST OF ASSUMPTIONS
  172.     7.1.1
  173.   7.2 UK MARKET SIZE ESTIMATES; FORECAST
  174.     7.2.1 BY OFFERING, 2025-2035 (USD Billion)
  175.     7.2.2 BY TECHNOLOGY, 2025-2035 (USD Billion)
  176.     7.2.3 BY BUSINESS FUNCTION, 2025-2035 (USD Billion)
  177.     7.2.4 BY VERTICAL, 2025-2035 (USD Billion)
  178.   7.3 PRODUCT LAUNCH/PRODUCT DEVELOPMENT/APPROVAL
  179.     7.3.1
  180.   7.4 ACQUISITION/PARTNERSHIP
  181.     7.4.1

UK Information and Communications Technology Market Segmentation

Information and Communications Technology By Offering (USD Billion, 2025-2035)

  • Solutions
  • Services

Information and Communications Technology By Technology (USD Billion, 2025-2035)

  • Cloud Computing
  • Big Data & Analytics
  • Blockchain
  • Cybersecurity
  • AI
  • IoT

Information and Communications Technology By Business Function (USD Billion, 2025-2035)

  • Accounting & Finance
  • Information Technology
  • Human Resources
  • Marketing & Sales

Information and Communications Technology By Vertical (USD Billion, 2025-2035)

  • BFSI
  • Retail & eCommerce
  • IT/ITES
  • Healthcare, Life Sciences & Pharmaceuticals
  • Government & Defense
  • Media & Entertainment
  • Manufacturing
  • Energy & Utilities
  • Telecommunications
  • Education
  • Agriculture
  • Automotive, Transportation, & Logistics

Compare Licence

×
Features License Type
Single User Multiuser License Enterprise User
Price $4,950 $5,950 $7,250
Maximum User Access Limit 1 User Upto 10 Users Unrestricted Access Throughout the Organization
Free Customization
Direct Access to Analyst
Deliverable Format
Platform Access
Discount on Next Purchase 10% 15% 15%
Printable Versions