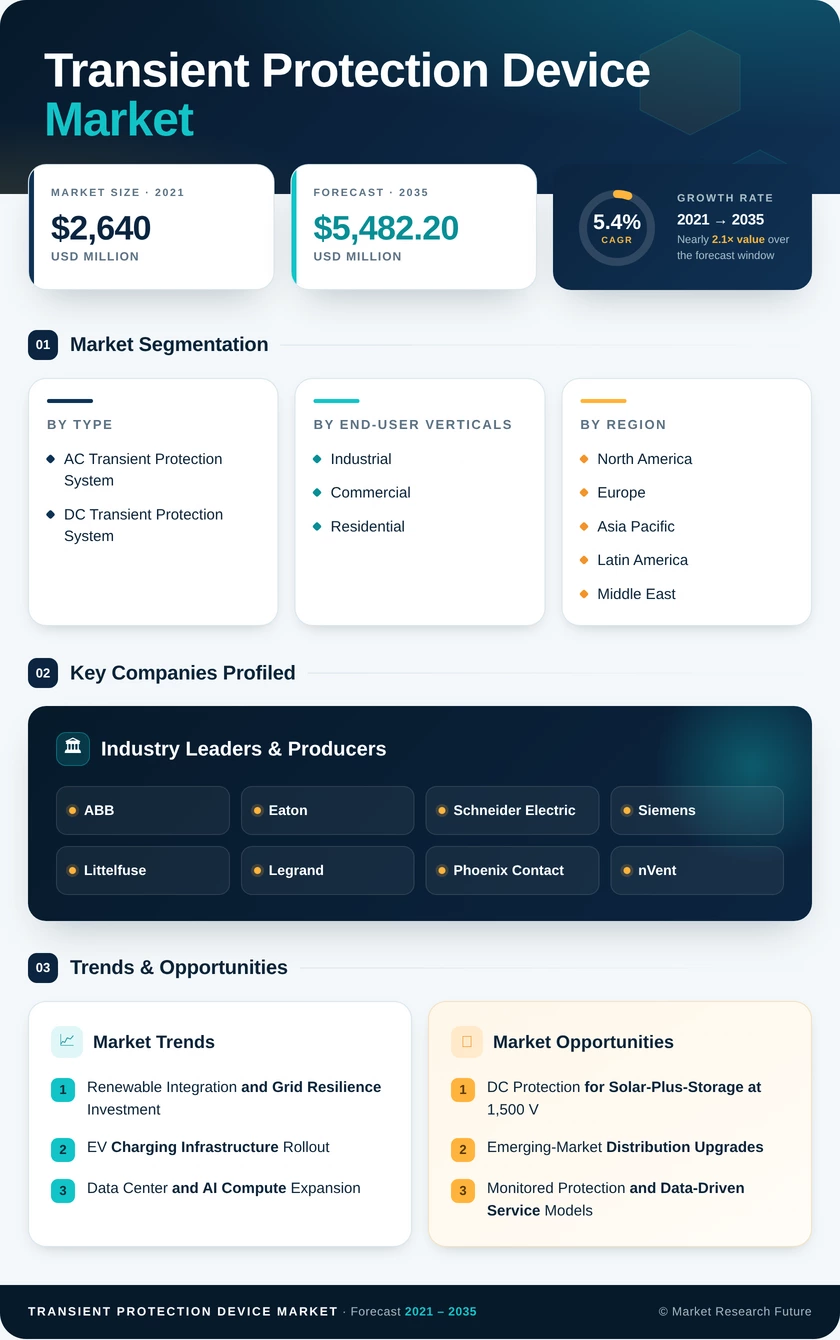
Transient Protection Device Market (2026 - 2035)

ID: MRFR/ICT/39639-HCR 100 Pages Aarti Dhapte Last Updated: October 18, 2026
Transient Protection Device Market Size, Share and Research Report By Type (AC Transient Protection System and DC Transient Protection System), By End-User Verticals (Industrial, Commercial, and Residential), And By Region (North America, Europe, Asia-Pacific, And Rest Of The World) – Industry Forecast Till 2035
Transient Protection Device Market
Market Size
Forecast Period2026-2035
CAGR (2026-2035)5.4%
2025 Market SizeUSD 3,240.0 Million
2035 Market SizeUSD 5,482.2 Million
Key Players
ABB
Eaton
Schneider Electric
Siemens
Littelfuse
Legrand
Opportunities
  • DC Protection for Solar-Plus-Storage at 1,500 V
  • Emerging-Market Distribution Upgrades
  • Monitored Protection and Data-Driven Service Models
  1. 1 Market Summary | |
  2. 2 Key Report Takeaways | |
    1. 2.1 By Type | |
    2. 2.2 By End-user Verticals | |
    3. 2.3 By Region | |
  3. 3 Market Size and Forecast (2021–2035) | |
    1. 3.1 Historical Market Size (2021–2024) | |
    2. 3.2 Base Year and Forecast Market Size (2025–2035) | |
    3. 3.3 Year-over-Year Growth Analysis | |
  4. 4 Driver Impact Analysis | |
    1. 4.1 Renewable Integration and Grid Resilience Investment | |
    2. 4.2 EV Charging Infrastructure Rollout | |
    3. 4.3 Data Center and AI Compute Expansion | |
    4. 4.4 Mandatory Surge Protection in Electrical Codes | |
    5. 4.5 Industrial Automation and Robotics Density | |
    6. 4.6 Smart Home and Connected-Device Adoption | |
    7. 4.7 Railway Electrification and Signalling Upgrades | |
  5. 5 Restraints Impact Analysis | |
    1. 5.1 Price Erosion from Low-Cost MOV-Based Products | |
    2. 5.2 Raw Material Price Volatility | |
    3. 5.3 Low Protection Awareness in Emerging Residential Segments | |
    4. 5.4 Counterfeit and Non-Certified Devices | |
    5. 5.5 Divergent Certification Regimes | |
  6. 6 Opportunities | |
    1. 6.1 DC Protection for Solar-Plus-Storage at 1,500 V | |
    2. 6.2 Emerging-Market Distribution Upgrades | |
    3. 6.3 Monitored Protection and Data-Driven Service Models | |
    4. 6.4 800 V DC Data Center Architectures | |
    5. 6.5 Rail, Telecom, and 5G Infrastructure | |
  7. 7 Regional Market Share and Country-Level Analysis | |
    1. 7.1 North America | | |
      1. 7.1.1 United States | | |
      2. 7.1.2 Canada | | |
      3. 7.1.3 Mexico | |
    2. 7.2 Europe | | |
      1. 7.2.1 Germany | | |
      2. 7.2.2 United Kingdom | | |
      3. 7.2.3 France | | |
      4. 7.2.4 Italy | | |
      5. 7.2.5 Spain | | |
      6. 7.2.6 Nordic Countries | | |
      7. 7.2.7 Russia | | |
      8. 7.2.8 Rest of Europe | |
    3. 7.3 Asia Pacific | | |
      1. 7.3.1 China | | |
      2. 7.3.2 India | | |
      3. 7.3.3 Japan | | |
      4. 7.3.4 South Korea | | |
      5. 7.3.5 ASEAN | | |
      6. 7.3.6 Rest of Asia Pacific | |
    4. 7.4 Latin America | | |
      1. 7.4.1 Brazil | | |
      2. 7.4.2 Argentina | | |
      3. 7.4.3 Rest of Latin America | |
    5. 7.5 Middle East and Africa | | |
      1. 7.5.1 Saudi Arabia | | |
      2. 7.5.2 United Arab Emirates | | |
      3. 7.5.3 South Africa | | |
      4. 7.5.4 Egypt | | |
      5. 7.5.5 Rest of Middle East and Africa | |
  8. 8 Future Outlook (2026–2035) | |
    1. 8.1 The Electrification Supercycle | |
    2. 8.2 Intelligent, Monitored Protection | |
    3. 8.3 The Shift to High-Voltage DC Architectures | |
    4. 8.4 Sustainability and Lifecycle Accountability | |
  9. 9 Segmentation Analysis | |
    1. 9.1 By Type | | |
      1. 9.1.1 AC Transient Protection System | | |
      2. 9.1.2 DC Transient Protection System | |
    2. 9.2 By End-user Verticals | | |
      1. 9.2.1 Industrial | | |
      2. 9.2.2 Commercial | | |
      3. 9.2.3 Residential | |
  10. 10 Competitive Landscape | |
    1. 10.1 Market Concentration Analysis | |
    2. 10.2 Competitive Benchmarking Matrix | |
    3. 10.3 Company Profiles | | |
      1. 10.3.1 ABB | | |
      2. 10.3.2 Eaton | | |
      3. 10.3.3 Schneider Electric | | |
      4. 10.3.4 Siemens | | |
      5. 10.3.5 Littelfuse | | |
      6. 10.3.6 Legrand | | |
      7. 10.3.7 Phoenix Contact | | |
      8. 10.3.8 nVent | | |
      9. 10.3.9 DEHN | | |
      10. 10.3.10 Hubbell | |
  11. 11 Recent News & Developments | |
  12. 12 Report Scope and Methodology | |
  13. 13 Detailed Sources and Citations | |
  14. 14 Frequently Asked Questions (FAQs) | | LIST OF TABLES | |
  15. TABLE 1 Market Snapshot — Key Metrics, 2025–2035 | |
  16. TABLE 2 Global Market Size & Forecast, by Revenue (USD Million), 2021–2035 | |
  17. TABLE 3 Driver Impact Analysis, 2026–2035 | |
  18. TABLE 4 Restraints Impact Analysis, 2026–2035 | |
  19. TABLE 5 Regional Summary, 2025 | |
  20. TABLE 6 North America Market, by Country, 2025 | |
  21. TABLE 7 Europe Market, by Country, 2025 | |
  22. TABLE 8 Asia Pacific Market, by Country, 2025 | |
  23. TABLE 9 Latin America Market, by Country, 2025 | |
  24. TABLE 10 Middle East and Africa Market, by Country, 2025 | |
  25. TABLE 11 Market Segmentation, by Type, 2025 | |
  26. TABLE 12 Market Segmentation, by End-user Verticals, 2025 | |
  27. TABLE 13 Competitive Benchmarking Matrix, 2025 | |
  28. TABLE 14 Report Scope and Methodology | |
  29. TABLE 15 Detailed Sources and Citations | | LIST OF FIGURES | |
  30. FIGURE 1 Market Dynamics Overview — Drivers, Restraints, and Opportunities | |
  31. FIGURE 2 Industry Value Chain Analysis | |
  32. FIGURE 3 Porter's Five Forces Analysis | |
  33. FIGURE 4 Market Size Trend, 2021–2035 (USD Million) | |
  34. FIGURE 5 Market Share by Type, 2025 (%) | |
  35. FIGURE 6 Market Share by End-user Verticals, 2025 (%) | |
  36. FIGURE 7 Market Share by Region, 2025 (%) | |
  37. FIGURE 8 Regional CAGR Comparison, 2026–2035 (%) | |
  38. FIGURE 9 Competitive Landscape — Estimated Revenue Share Ranges, 2025 | |
  39. FIGURE 10 Recent Strategic Developments Timeline, 2023–2025

Segmentation Quick Reference

DimensionSub-SegmentsDominant SegmentFastest Growing Segment
By TypeAC Transient Protection System; DC Transient Protection SystemAC Transient Protection System (68.5% share)DC Transient Protection System (7.2% CAGR)
By End-user VerticalsIndustrial; Commercial; ResidentialIndustrial (44.0% share)Residential (6.3% CAGR)
By RegionNorth America; Europe; Asia Pacific; Latin America; Middle East and AfricaNorth America (35.0% share)Asia Pacific (6.6% CAGR)

Market Segmentation Overview

By Type

Sub-SegmentKey Trend
AC Transient Protection SystemHybrid MOV-diode modules with remote status contacts replacing basic varistor units
DC Transient Protection System1,500 V PV and 1,000 V EV-charging designs certified to IEC 61643-31

AC Transient Protection System leads with a 68.5% share because every grid-connected building and plant needs service-entrance and panel protection on its AC distribution. DC Transient Protection System grows fastest at a 7.2% CAGR, as solar arrays, battery racks, and fast chargers run on DC buses where arcs are harder to quench and require purpose-built, separately certified devices.

By End-user Verticals

Sub-SegmentKey Trend
IndustrialProtection specified on drives, PLC networks, and instrumentation loops
CommercialMonitored devices standard in data centers and hospitals
ResidentialWhole-home protection mandated under NEC 230.67

Industrial holds a 44.0% share because plants concentrate drives, controllers, and robots whose failures carry high downtime costs. Residential expands fastest at a 6.3% CAGR as code mandates spread and homeowners add rooftop solar and batteries, while Commercial, worth USD 1,069.2 million, remains anchored by data center and healthcare demand for monitored, premium devices.


Download PDF ×

We do not share your information with anyone. However, we may send you emails based on your report interest from time to time. You may contact us at any time to opt-out.