Segmentation Quick Reference
| Dimension | Sub-Segments | Dominant Segment | Fastest Growing Segment |
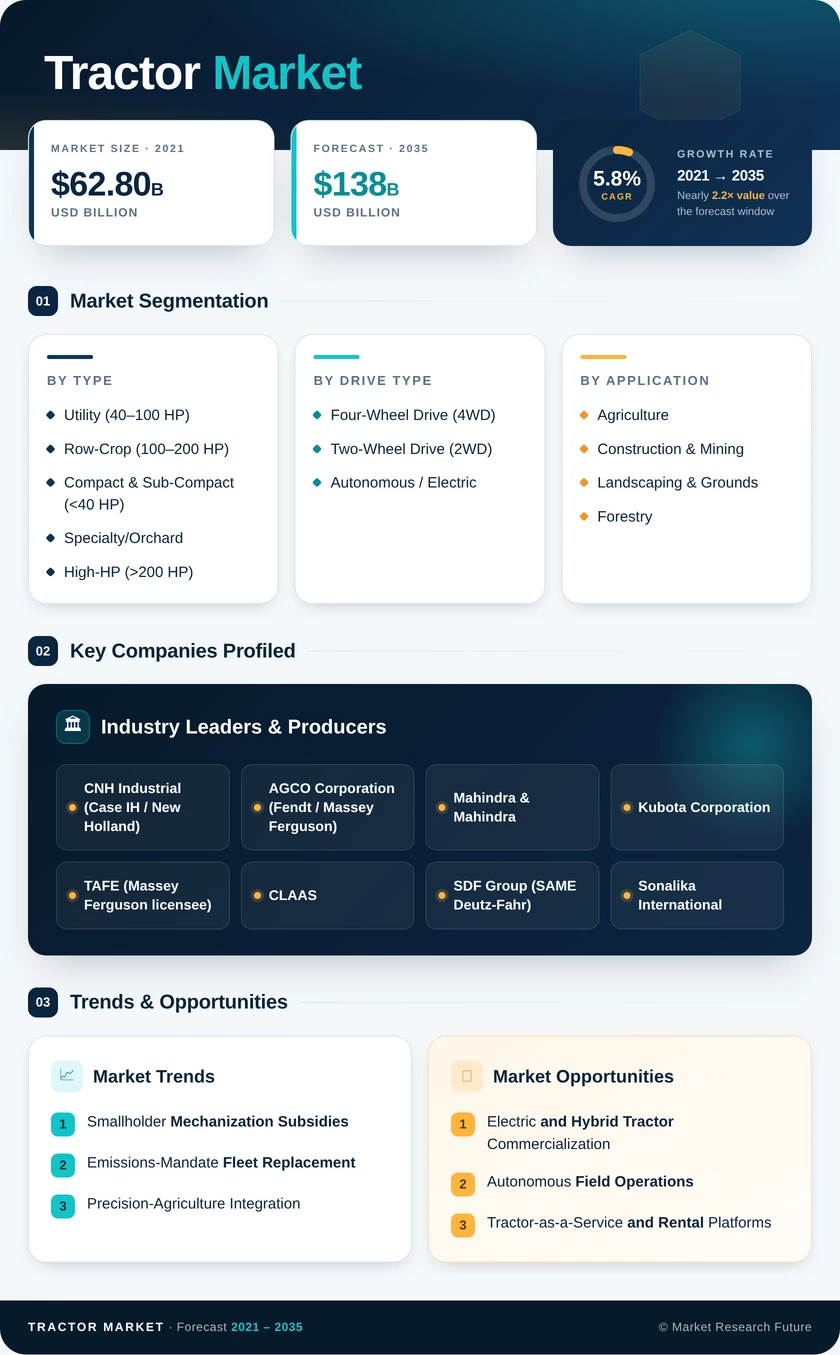
| By Type | Utility (40–100 HP); Row-Crop (100–200 HP); Compact & Sub-Compact (<40 HP); Specialty/Orchard; High-HP (>200 HP) | Utility Tractors (40–100 HP) | Row-Crop Tractors (100–200 HP) |
| By Drive Type | Four-Wheel Drive (4WD); Two-Wheel Drive (2WD); Autonomous / Electric | Four-Wheel Drive (4WD) | Autonomous / Electric |
| By Application | Agriculture; Tractor Market & Mining; Landscaping & Grounds; Forestry | Agriculture | Tractor Market & Mining |
Market Segmentation Overview
By Type
| Sub-Segment | Key Trend |
| Utility Tractors (40–100 HP) | Broad developing-market adoption; value-engineering by Indian OEMs |
| Row-Crop Tractors (100–200 HP) | Precision-agriculture payload upsell; software-subscription attach |
| Compact & Sub-Compact (<40 HP) | Lifestyle-acreage growth in North America and Oceania |
| Specialty / Orchard Tractors | Narrow-frame and low-profile demand in Mediterranean viticulture |
| High-Horsepower Tractors (>200 HP) | Articulated four-wheel platforms for broadacre grain and sugarcane |
Utility tractors anchor global unit volumes, while row-crop and high-HP segments drive revenue growth through higher transaction values and technology content.
By Drive Type
| Sub-Segment | Key Trend |
| Four-Wheel Drive (4WD) | Penetration rising in India and Brazil; standard in premium segments |
| Two-Wheel Drive (2WD) | Declining share but resilient in price-sensitive smallholder markets |
| Autonomous / Electric | Early-stage commercialization; rapid CAGR from a small base |
Four-wheel drive remains the dominant configuration and continues to take share from 2WD across all regions. Autonomous and electric platforms represent the long-term disruption vector.
By Application
| Sub-Segment | Key Trend |
| Agriculture | Core demand driver; tied to the food-production mechanization cycle |
| Tractor Market & Mining | Crossover industrial-tractor demand from infrastructure spending |
| Landscaping & Grounds | Municipal and commercial property maintenance; compact-tractor-led |
| Forestry | Specialized crawler and skid-steer tractor platforms |
Agriculture accounts for the vast majority of global tractor demand. Tractor Market-grade tractor platforms represent the fastest-growing application niche, fueled by infrastructure investment in emerging economies.