Segmentation Quick Reference
| Dimension | Sub-Segments | Dominant Segment | Fastest Growing Segment |
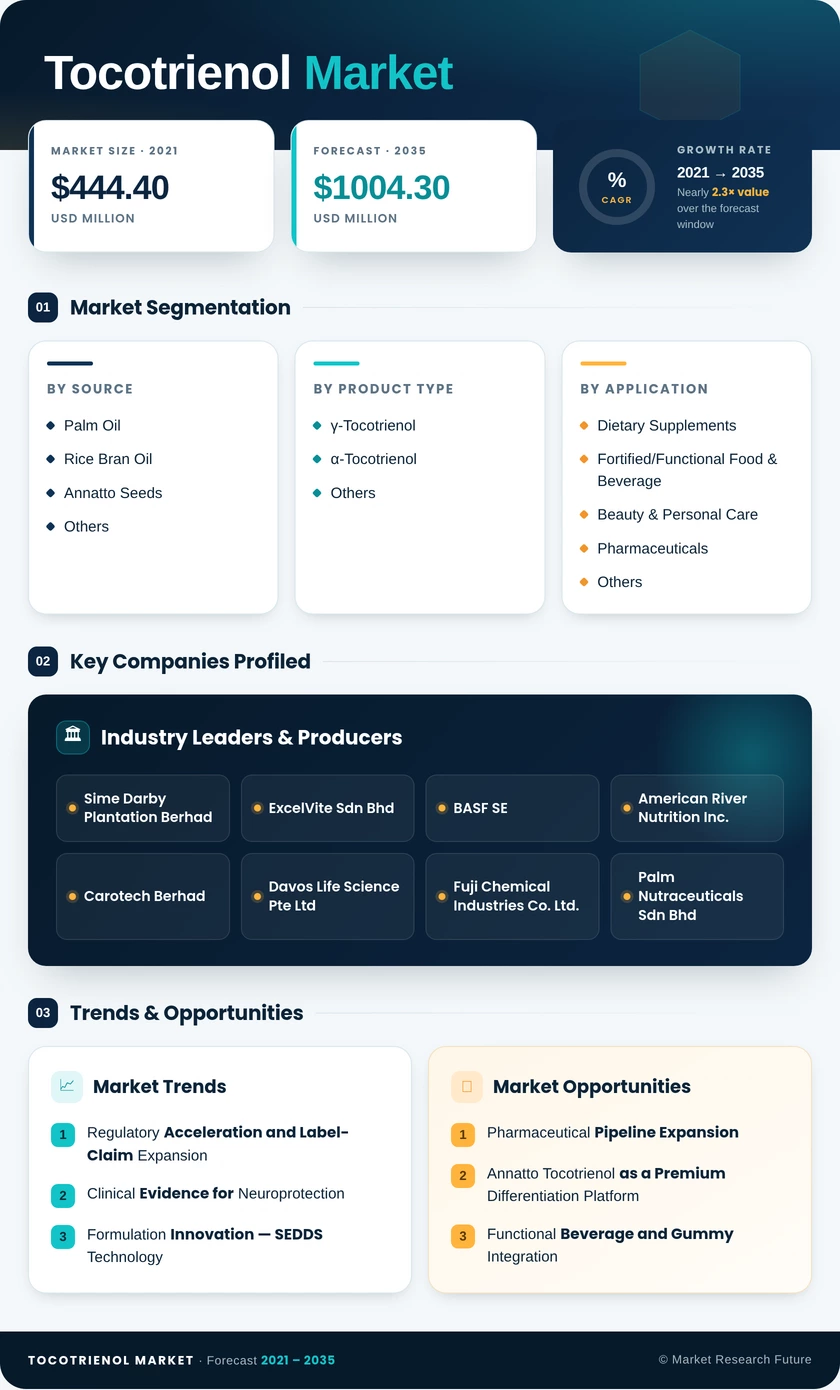
| By Source | Palm Oil, Rice Bran Oil, Annatto Seeds, Others | Palm Oil (69.8% share, 2025) | Annatto Seeds (9.78% CAGR) |
| By Product Type | γ-Tocotrienol, α-Tocotrienol, Others | γ-Tocotrienol (55.5% share, 2025) | α-Tocotrienol (9.62% CAGR) |
| By Application | Dietary Supplements, Fortified/Functional Food & Beverage, Beauty & Personal Care, Pharmaceuticals, Others | Dietary Supplements (USD 210.84M, 2025) | Beauty & Personal Care (9.50% CAGR) |
| By Geography | North America, Europe, Asia-Pacific, South America, Middle East & Africa | North America (35.7% share, 2025) | Asia-Pacific (9.27% CAGR) |
Market Segmentation Overview
By Source
| Sub-Segment | Key Trend |
| Palm Oil | Dominant supply base leveraging deodorizer distillate byproducts from integrated palm refineries |
| Rice Bran Oil | Growing in Asia-Pacific where domestic milling infrastructure reduces import dependency |
| Annatto Seeds | Premium tocopherol-free positioning driving fastest source-segment growth |
| Others | Includes specialty botanical extracts with limited commercial scale |
Palm oil continues to supply the majority of global tocotrienol volume through vertically integrated refining operations in Malaysia and Indonesia. Annatto seeds are rapidly gaining share as the only commercially viable tocopherol-free tocotrienol source, attracting formulators prioritizing biochemical purity.
By Product Type
| Sub-Segment | Key Trend |
| γ-Tocotrienol (Gamma) | Broadest evidence base for cholesterol management and anti-inflammatory activity |
| α-Tocotrienol (Alpha) | Emerging neuroprotective clinical pipeline driving premium pricing |
| Others (δ, β, Mixed) | Full-spectrum complexes popular in general-wellness supplement formulations |
Gamma-tocotrienol remains the workhorse isomer in the commercial tocotrienol supply chain, while alpha-tocotrienol is transitioning from research curiosity to high-value pharmaceutical ingredient based on stroke-prevention trial data.
By Application
| Sub-Segment | Key Trend |
| Dietary Supplements | Largest revenue contributor; driven by clean-label and natural vitamin E demand |
| Fortified/Functional Food & Beverage | SEDDS technology enabling water-dispersible formats for beverages and gummies |
| Beauty & Personal Care Products | Fastest-growing application; nutricosmetics integration accelerating |
| Pharmaceuticals | Clinical-trial pipeline for neurodegenerative and cardiovascular indications |
| Others | Animal nutrition and industrial antioxidant applications |
Dietary supplements remain the primary demand channel for tocotrienols globally. Beauty and personal-care applications are expanding rapidly as topical and ingestible tocotrienol formats penetrate the premium nutricosmetics category.